INTRODUCTION
In early experiments that attempted to create radio waves, it was noticed that light shining on an electrode sometimes produced a visible spark. Later experimentation found that these sparks were created by the impact of light on an electrode, which caused the ejection of electrons. It was also found that these ejected electrons had kinetic energies that increased linearly with the frequency of the light used. These observational results were explained by Einstein assuming that light behaves as a particle.
THEORY
The apparatus consists of a mercury source behind a slit, a diffraction grating and a lens which focuses an image of the slit in the wavelength of each mercury line on a photo tube. The electrons ejected from the surface in the photo tube run along a wire to charge a capacitor to roughly their highest energy (since they have to overcome the repulsive force of all the other electrons gathered on the capacitor to charge it), so the measured voltage gives us a measure of this energy (also called the stopping potential, Vstop).
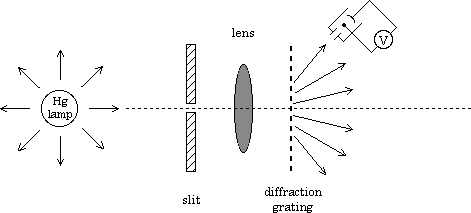 The apparatus |
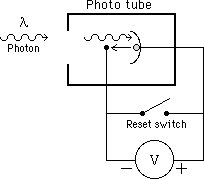 Photo head detail |
Electrons on the metal surface absorb photons of energy E = hf, where h is Planck's constant. When part of this photon energy (the work function, φ) is greater than the energy necessary to free the electron from the surface (the binding energy), the electron jumps off the surface with the remainder of the photon energy going into the electron’s kinetic energy:
Kmax = hf - φ
These electrons strike one of the capacitor plates and charge it up. Eventually, the capacitor voltage becomes large enough to stop further charging. This happens when
Kmax = eVstop
Thus, using a little algebra, the stopping potential can be written as
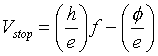
Of the quantities in this equation,
The equation for Vstop looks suspiciously like our linear friend, y = mx + b. Thus, if we plot the measured Vstop versus f we should get a straight line. From the slope we can find Planck’s constant and from the intercept we can find the work function, φ, and hence the binding energy of the electrons.
EXPERIMENT
| You'll note that the 2nd order image lines are fainter and broader than the 1st order. Since the kinetic energy of the ejected electrons depends upon the freqency (i.e. color), and not the intensity of the light used, your stopping potentials for the 1st and 2nd order images should be very close. Are they? |
| Line Color | Wavelength, λ (nm) |
Frequency, f (Hz) |
Vstop 1st order (volts) |
Vstop 2nd order (volts) |
<Vstop> 1st order (volts) | <Vstop> 2nd order (volts) |
| Violet #1 | 365.0 | |||||
| Violet #2 | 404.7 | |||||
| Blue | 435.8 | |||||
| Green | 546.1 | |||||
| Orange | 578.1 |
CONCLUSION
|
|
||
| © | St. Lawrence University | Department of Physics |
| Revised: 16 May 17 | Canton, NY 13617 |