

The Hydrogen Spectrum & Energy Levels
BlackBoard Notes
======================= Photo - Click for a Larger Version =============================

======================= First Board Section =============================
- Measure λ's for visible lines of Hydrogen
- Calculate expected λ's and identify transitions producing the lines observed
- Do Not Move the Spectrometers!
- (If needed, after Jeff retires:) Lab Evaluations!
- On front bench
- Fill one in (out?)
- No name required
- Leave pages stapled together
======================= Second Board Section =============================
- Wavelength of each H-line:
- Measure θ for each line, to 0.1°
- Measure θ for Yellow line of sodium (λNa
= 589.3 nm)
- Calculate d from θNa measurement:
- mλ = dsinθ
- Check your value of d with me!
- Use your d to calculate λH for each hydrogen line observed
- Calculate λ to 0.1 nm (4 sig figs)!
======================= Third Board Section =============================
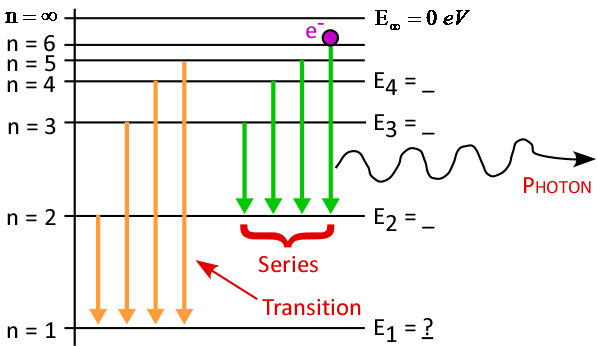
- Energy level diagram (on today's Journal template):
- Drawing note for Jeff:
- First draw horizontal lines for n = ∞ and n = 1
- Label n = ∞ as "Ionization Level"
- Fill in other levels by taking ½ of available space
- Finish with vertical axis and transitions
- Equations may run into the Fourth Board Section
 |
See instructions for Excel notes! |
- Which transitions created each H-line observed?
- Turn off H-bulb when angle measurements are finished!
======================= Fourth Board Section =============================
Spectrometer Alignment Notes: (Note that this section will be tight on space!)
- Move front of spectrometer base left and right so zeroth-order image is pink, not pink and blue!
- Move telescope by pushing the angle pointer, NOT the eyepiece!
- Hold one hand on base to keep it from moving
- Rotate eyepiece to align cross hair parallel to spectral line.
 |

View of zeroth-order image
|
Return to Setup
|
Revised: 14 Jul 26
|
Canton, NY 13617
|