- Computers are needed for lab this week
- The acceleration of a mass is measured using a paper tape timer
- This is their first lab journal, so you might wish to be particularly picky about the format when grading
- Fall 2024: I have changed the nature of the lab journal in Phys103/104. It now is done in Excel. There are still some growing pains but it is much easier to grade without having to read students shitty handwriting.
- Fall 2022: I have officially changed the word 'report' to 'journal' in all lab instructions. I have not yet made this change in any of the Instructor Notes other than this one, so deal with it.
- We now have 8 timers. Woo-hoo!
- Jeff will usually replace or adjust the carbon paper on each timer before the first lab section, so they should be good for the rest of the week
- The procedure for preparing the paper tape, loading and starting the timer is as follows:
- Tear off a piece of paper tape that is a little shorter than the height of the timer above the ground; this will hopefully minimize the problem with the last data point being recorded after the mass hits the floor
- Make a loop at the 'bottom' end of the paper tape (secure with masking tape)
- Feed the 'top' of the paper tape through the timer (between the carbon disc and metal striker plate)
- Attach the hook of the 200-g mass to the paper tape
- Hold the paper tape near its top so that the tape is vertical when looking from the front and side of the timer (this is checked by the partner)
- Two step stools are in the lab for those that might need a boost
- Hold the paper tape motionless, have lab partner turn on timer (move switch to the left)
- Drop the tape. Take care not to let the paper tape drag along your hand; watch students while they do a drop to make sure they're not doing this either
- Turn off timer by pushing switch to its center position
- Examine each groups' tape; make sure they can identify the first clear dot as 'zero' point
- Have students repeat drop if it doesn't look good (they might be able to use the back side of tape)
- Students want to fit an exponential function to their data, but Excel won't let them (and rightly so!). A teachable moment!
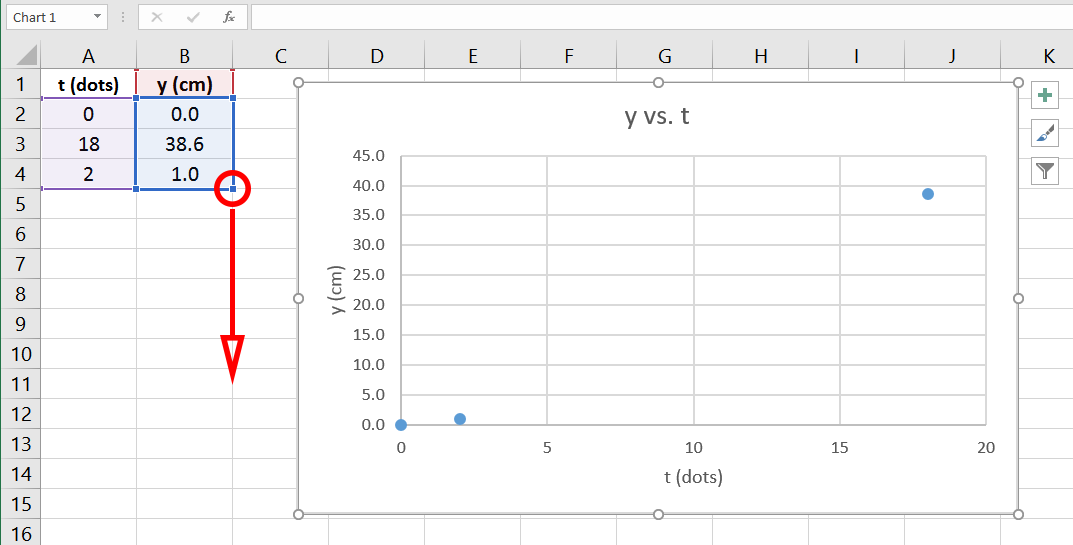
- (Fall 2024: Note that the following is now covered in the Graphing with Excel exercise.) Here's the procedure for adding new data points to an Excel graph, created with three data points:
- Click on the graph to select it; the three data points will be highlighted
- Move the cursor over the handle in the lower-right corner of the selected data (Figure 1); the cursor will change from a fat '+' to a small, angled, double-arrowed line
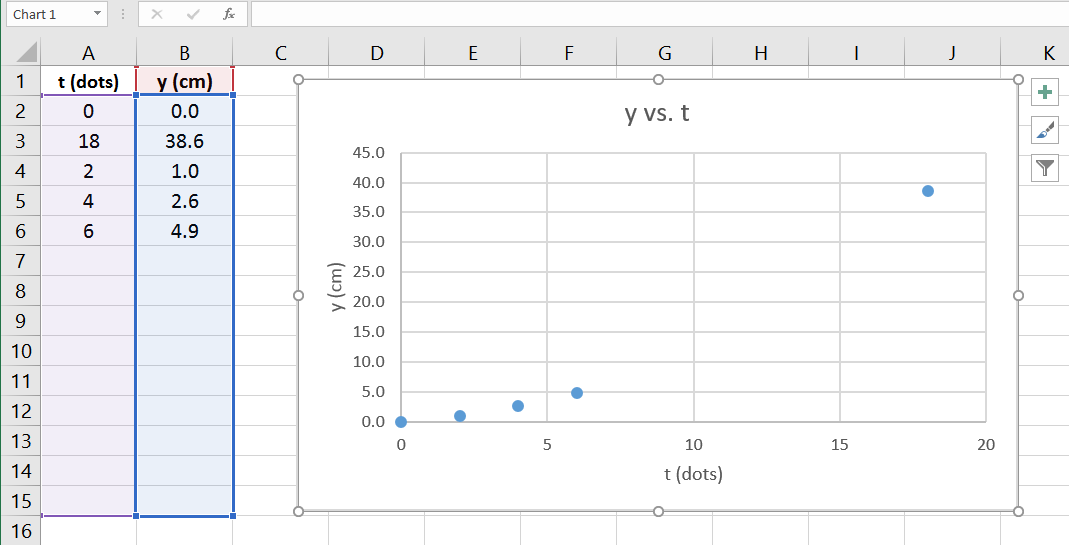
- Click on the handle and drag straight down a bunch of rows, beyond the last data point (Figure 2)
- Voilà! Newly entered data will automatically appear on the graph

Figure 1 |

Figure 2 |
- Fall 2024: I have finally given up and no longer give them the number of data points they're using in the instructions. Only the column headers are given.
- At the current height of the timers, students will label 18 even-numbered dots (so, they will have 9 data points). I previously had '20' listed in the instructions because it's a nice 'round' number, but their inability to adapt confused the shit out of them. I finally relented and have changed it to '18' in the instructions. *sigh*
- Student results of acceleration are placed on the board; they generally should measure ao < g, since the paper tape drags through the timer. When the weather cooperates, the accelerations are usually within about 5% of g. If the weather is particularly humid, the accelerations will be much lower than expected, as seen in this data from previous years:
-
| Year |
Day |
ao (cm/s2) |
%diff |
Comments |
| 2022 |
Monday |
958.1 |
-2 |
Very Humid |
| |
|
943.7 |
-4 |
|
| |
|
933.1 |
-5 |
|
| |
|
938.2 |
-4 |
|
| |
|
793.6 |
-21 |
|
| |
|
825.7 |
-17 |
|
| |
Tuesday |
956.5 |
-2 |
Dry |
| |
|
968.6 |
-1 |
|
| |
Wednesday |
981.8 |
+0.2 |
Dryer! |
| |
|
974.1 |
-0.6 |
|
| |
|
967.0 |
-1 |
|
| |
|
978.9 |
-0.1 |
|
| |
|
972.5 |
-0.8 |
|
|
| 2015 |
Monday |
963.8 |
-2 |
Humid |
| |
|
949.8 |
-3 |
|
| |
|
934.4 |
-5 |
|
| |
|
986.9 |
+0.5 |
|
| |
|
964.2 |
-1.6 |
|
| |
|
|
|
|
| |
Wednesday |
879.7 |
-11 |
Very humid & pouring rain |
| |
|
812.0 |
-19 |
|
| |
|
962.9 |
-1 |
|
| |
|
970.9 |
-1 |
|
| |
|
926.7 |
-6 |
|
| |
|
859.0 |
-13 |
|
| |
|
904.6 |
-8 |
|
| |
|
953.9 |
-3 |
|
|