- Computers are needed for lab this week
- An electronic balance is not required this week, but bring one out if students ask
- The purpose of this experiment is that students must devise an experiment to test the validity of an experimental model
- This used to be performed with cotton balls and a stop watch, but the data were always lousy
- Balloons need to be purchased every year, since they're more likely to break when sitting around for a year. 12-inch latex balloons were purchased at the local dollar store and they were sufficient.
- Important Note: We used to use helium-quality balloons, but they are no longer necessary since we don't have them tape a timer to the balloon anymore.
- Pre-lab notes:
- I tell students during the pre-lab that they can ask for any other instrument that they think they might need
- During Fall 2021, the impact timers were so unreliable that they were unusable, and we had students use their smart phones for timing. Some students were pretty creative; one group recorded video of the balloon drop with their laptop in the frame and showing a timer. I'll leave these instructions here in case an impact timer needs to be used:
- Show them how the timer works:
- Press and hold the button on the timer
- Release the button at the same time the timer is dropped
- The timer stops when it hits the ground (cardboard)
- Press the button again to reset the timer
- Also tell students that once they tape the timer to the balloon, it will probably burst when the tape is removed
- Once students have started on the lab, you can walk around and ask each group what their plan is for the experiment. I wouldn't give too much advice at this point, but perhaps ask a question to make them think about something stupid that they're about to do
 There are two tasks that are to be performed before coming to lab. In case you're brain dead (as I frequently am), here's the solutions: There are two tasks that are to be performed before coming to lab. In case you're brain dead (as I frequently am), here's the solutions:
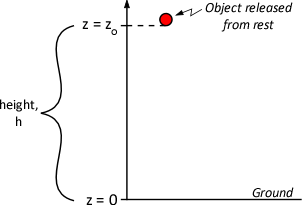
- Task 1: Show how to get Equation 2 from Equation 1 for this situation:
- From Figure 1 (at right), we see that zo = h, z = 0, a = -g and vo = 0, so:
- Task 2: If you plot h as a function of t2, what kind of trend do you expect to see in the data?
- This graph should give you a straight line with the slope = ½g and intercept = 0
- I'll basically accept anything they do as long as they've followed correct experimental procedure to test the theory! It doesn't matter if they support or refute the proposed model!
- Frequently, students want to calculate g for each data point! This hopefully has been addressed during earlier graphing exercises
- Nope! So far, this hasn't worked. The first instinct of many students is to calculate g for each measurement, and they should be chastised for doing this
|