- Computers are needed for lab this week
- Conceptually, this is one of the most difficult experiments for students to understand!
- The method used to analyze the motion of the cart on the track are derived from conservation of energy theory. This point should be emphasized!
- They also fail to realize that v2/2 is proportional to the kinetic energy, and that x is proportional to h, the vertical distance the cart falls and hence the initial potential energy – both of which are the basic points of the experiment
- This experiment can also take them a long time to finish, so you should encourage them to work efficiently. They should be starting their elastic collisions around ~2:15 pm, and finish data collection by ~3:15 pm; if not, they're falling behind, and they'll be hanging around until 5:00 pm (or later)

- This is the first time that vernier calipers are used! Each person should have their own pair of calipers. Briefly explain the different measurements that can be taken with the calipers (inside; outside; depth). Each setup has two pieces of plastic pipe (shown at right) that students can use for practice (measure the inside and outside diameters). Tell students to follow the directions carefully (hah!), and check that they have read the vernier scale correctly. A lab practical skill!
- Students will use the KaleidaGraph fit Linear w/Uncertainties: a + b*x; a=1;
b=1;
- Track Notes:
- The silver tracks have a board clamped to one edge of the bench; the double-legs of the track should rest up against the board so that the hard plastic feet don't slide on the table when the cart hits the end of its run!
- All eight tracks will use the same gold carts. The bumper on the high side of the black tracks needs to be flipped up so that the carts can fit!
- The ruler on all tracks (silver and black) is calibrated in millimeters. This causes confusion since they can't figure out where the 160 cm position is located
- Students will calculate a value of g·sinθ from their graph that they compare to a value calculated from their measurement of track angle, θ.
- Don't tell students that g·sinθ is acceleration! The best students will already know this or figure it out, but we're saving talk of acceleration until the next air track experiment.
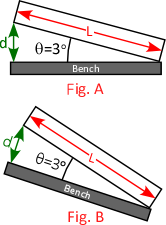
- There is frequently a disagreement here, since the angle is very small, and the uncertainty in the level of the table can overwhelm even the most careful measurement. A perfect opportunity to discuss measurement uncertainty! Note that this problem was minimized when the lab benches were leveled during Summer 2019 but not eliminated!
- Example: Careful measurement of the track length and elevation gives an angle of 3° (Fig. A, right). However, if the table were tilted at 30° (Fig. B) the true angle of the track could be anywhere from 27° to 33°!
- You can demonstrate this using an old inclined plane (non-Major's stockroom, shelf R1) to mimic Figures A and B. I'll try to remember to put one in the lab for a demo
- Expected track angle results:
- Black tracks (A,B,C,D): d = 9.0 cm; L = 137.0 cm (measured between the fronts of the feet that contact the table). So, θ = 3.77°, and g·sinθ = 64.4 cm/s2
- Silver tracks (E,F,G,H): d = 9.0 cm; L = 180.5 cm. So, θ = 2.86°, and g·sinθ = 48.9 cm/s2
- Make sure that students calculate L as the difference between two measurements!
- Photogate notes:
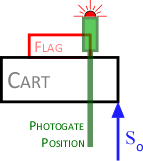
- The photogate is positioned so that it is tripped when the front edge of the cart is at the 160 cm mark (figure at right). The procedure in the instructions is necessary since the flag is not flush with the front edge of the cart. Some students may realize that the flag can be moved to the front edge of the cart. This is fine, but the flags on the carts they will use on the lab practical are screwed in place, so knowing the correct procedure is important. Don't tell them about the lab-practical carts, but ask what they would do if the cart was fixed in place. Some might try to measure the offset, which is a lot harder and will introduce more error than just following the instructions!
- Make sure that the timer is tripped by the flag, not the cart itself. This is especially important to check after inclining the track
- Common problems:
- Despite an explanation in the instructions, they don't know what <t> represents! Be sure to explain this notation
- If students don't follow the directions (do they ever?), they won't (a) plot their points as they're collected, and/or (b) show the origin on their KaleidaGraph plot. Without the origin displayed, they'll pile up all their data points at longer values of 'x'
- The cart velocity is (correctly) calculated from the length of the flag (~10 cm) and the average time, <t> for every distance the cart travels, x. This will give a maximum value of v2/2 somewhere around 8000. If their max v2/2 value is on the order of 106, then they calculated the velocity using x and <t>! If they're plotting their data (and they usually aren't), the points will follow a decidedly non-linear trend
- From their graph, students will note that the origin is not at zero as predicted by theory. Ask leading questions to get them to the point: The vertical axis is v2/2; if the cart stopped at the photogate, then its velocity would be zero. Since the entire 10 cm flag must pass through the photogate, the cart does not stop until some point later!
- During discussion of results, ask students if they think something went wrong, or perhaps they should check other's results to see if they found the same non-zero result!
- Ask students what could be done to improve this result? Answer: shorten the length of the flag!
- Note that this experiment favors crappy data! If g·sinθ falls within the uncertainty of their slope measurement, they likely have a data point that is not on the best-fit line. This gives them a larger uncertainty, and they think everything it right with the world
- Things to look for when grading their reports:
- Photogate setting and track used are recorded
- Drawing accuracy - did they clearly show where they measured to determine θ?
- The dimension measured between the track legs is the difference between two readings taken with a 2-m meter stick; therefore, both readings must be recorded
- Mentioning the measurement instruments used
- ".0" in data table
- Enough trials for each distance?
- SSR
- Intercept meaning?
- When referring to causes of error in angle measurement, specifically the fact that the lab bench is not level: they'll use the terms 'flat' and 'level' interchangeably
|