- Computers are needed for lab this week – ideally, one computer per student!
- A set of linear data is analyzed graphically, by hand calculations and by using KaleidaGraph
- Ideally there should be one computer available for each student. Far too often the 'partner' is left to make all the graphs during the semester, and then students are clueless during the lab practical. Unfortunately, this may not be possible with larger lab groups
- This is the first time that students get to use KaleidaGraph, which is quite different than Excel or Google Sheets. Be sure that you are familiar with using KaleidaGraph so that you can better assist students!
- One thing that students seem to do somewhat frequently – and I can't figure out how they're doing it! – is that the graph and data window will loose connection with each other. If this happens, hit the 'grid' icon in the upper right corner of the graph; this will produce a new data window from the graph, and they can continue with this data set
- In order to get the best results from the hand calculations in this exercise (so that they match the KaleidaGraph calcs), numbers should not be rounded until the final result. Students should learn how to use the multiple memory functions on their fancy graphing calculator!
- Students will ask if they can use Excel for the 'hand calculations'. This is fine as long as they write out a sample calculation and print the spreadsheet they created for the calculations
- Recent Changes:
- (Fall 2023) I've nuked the graphing by hand section
- (Fall 2017) I have decided to remove Watson's simulation. Students were spending too much time on it, and since they're also learning KaleidaGraph, they encounter information overload so they don't get anything out of it
- I've added an "Analyzing the Graph" section in the "Fitting Data…" directions. This details the procedure of rearranging a model equation in the form of the fit-function used on the graph. I intend to emphasize this as the procedure used every time we have graphed data, to (hopefully) minimize the number of people who want to calculate slope for each data point. Note: so far (Fall 2018), this hasn't made a difference. *sigh*
- My Results:
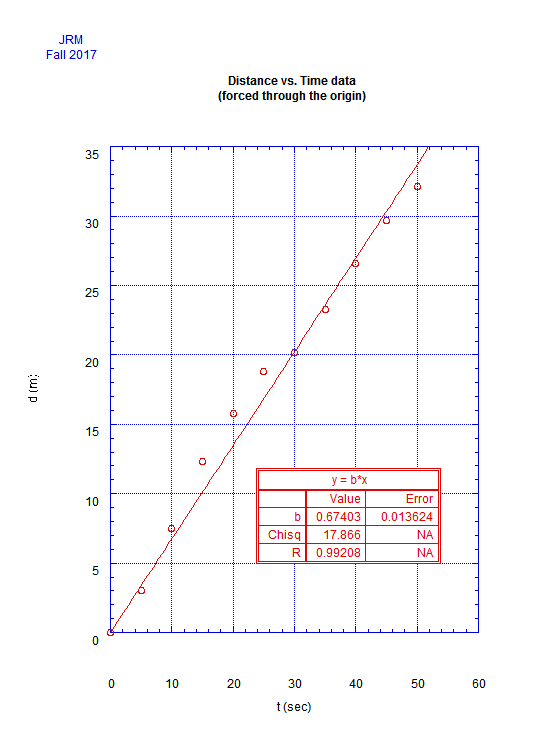
- Barring rounding and calculation errors, students should get the same results for their calculations and KaleidaGraph plot: vo = 0.674 ±0.0272 m/s, SSR = 17.866 m2
- Printing Problems – Two issues you'll generally encounter with students printing graphs
- Under the File menu, the first command they encounter is "Print Setup". Students will choose this command, then stand by the printer waiting for their graph. They need to choose "Print Graphics" (the graph needs to first be clicked as the active window for this command to appear)
- There is a long-standing bug in KaleidaGraph in which it will only print 1 copy of a graph, no matter how many copies are selected. Simply issue the Print command for each copy needed
- The best-fit of the data does not go through the origin; however, in order to make all results of slope match, the best-fit line of the graph should be drawn through the origin. The hand calcs assume that the best-fit goes through the origin
- I have installed a 'custom' fit called "Linear Through Origin" in KaleidaGraph that forces the best-fit through the origin: a*x; a=1
- It should be emphasized to students that they will never use this fit again in this course; it was created strictly for this exercise. The weakest students will use this function again, especially on the lab practical. *double-sigh*
- Units are important, especially for SSR (the 'Chisq' value of KaleidaGraph). Students will often forget to record the units for SSR on subsequent labs, or even remember which value in KaleidaGraph gives that value. *triple-sigh*
|