- Computers are NOT needed for lab this week
- Fall 2022 Updates:
- I have officially changed the word 'report' to 'journal' in all lab instructions. I have not yet made this change in any of the Instructor Notes other than this one
- Room swap this week with Phys103; the 103 "Position & Time" experiment requires more space to spread out, so they use the larger lab
- Before starting the experiment, briefly go over the syllabus, and the lab journal format, including the sample lab journals
- The purpose of this experiment is for students to practice basic data collection, analysis, and recording techniques. All data collection and graphing are done by hand; computer graphing techniques are introduced later
- A grade for this lab is created, but not averaged in to the lab grade. Therefore, you should be extremely picky about their journal! Things to look for:
- Units, sig figs
- Brief explanation of what they're doing and what they're calculating
- Graph: All the stuff a good graph should contain: Title; axis labels (with units); appropriate scaling and plotting
- Spring measurement: make sure that their spring lengths are the difference between two measurements! This is a very important technique for future experiments and the lab practical!
- Their discussion should mention the theory, and the parts that are (and are not) consistent with it
- When grading their lab journals, I usually don't pay too much attention to the content of their discussion. This lab is more concerned with the format of the journal, and techniques of data collection and analysis
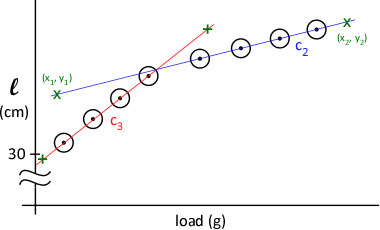
 The top spring contains a chain within to limit the amount it can be stretched. The resulting graph (at right) will show a linear region where both springs are stretching, and another linear region (of different slope) where the top spring has reached its limit and only the bottom spring continues to stretch. The top spring contains a chain within to limit the amount it can be stretched. The resulting graph (at right) will show a linear region where both springs are stretching, and another linear region (of different slope) where the top spring has reached its limit and only the bottom spring continues to stretch.
- Students should expect that there will be some transition region between these two slopes; data points at smaller mass increments should be taken here to more well-define this region
- The region where the springs are lightly-loaded is also non-linear; it is left to the student - with sufficient prodding from the instructor - to figure out more data points need to be collected here as well
- Be sure to talk to the students about the importance of graphing as they collect their data. I usually wait until I find a group that has more than a few points in their data table, but have not yet started the graph; I then ask them how they know if they have good data. I then discuss with them and the entire group the importance and advantages of immediate graphing:
- For the most part, they'll know ahead of time what the graph is expected to look like; allows them to find problems before wasting their time collecting crappy data
- Even if they don't know what to expect for their graph, they should expect to see some smooth function develop (at least with the experiments we're performing), again saving time
- When looking at students whose graphs are nearly complete (especially the lightly-loaded region), I usually start asking questions: since their graph is very linear in the expected regions, do they think they did something wrong? Perhaps there's something else going on in the experiment. How can you check this? Eventually they can be led to go peek at another groups results, which should show the same result as theirs (unless the other group has crappy data!)
- When all (most?) groups have finished their graphs, it's worth having a class discussion of the lightly-loaded region. What's the cause? Pull lightly on the spring system to see that the coils do not separate evenly in the top spring when a light force is applied; therefore, these springs do not begin to obey Hooke's Law until some minimum force is applied
- What's the lesson here? More may be occurring within an experimental system than is predicted by a simplified theory, and it is their job to think about and analyze these anomalies
|
 The top spring contains a chain within to limit the amount it can be stretched. The resulting graph (at right) will show a linear region where both springs are stretching, and another linear region (of different slope) where the top spring has reached its limit and only the bottom spring continues to stretch.