- Computers are needed for lab this week
- Depending on the textbook used, the notation of the work function may be different (φ, W, φW, Eo, etc.). This needs to be checked at the beginning of each spring semester
- Turn on the Hg lamps just before lab begins. They'll be warmed up by the time students are ready to collect data
- Tell students to leave the Hg lamps turned on; you can turn them off when all have left from a setup. The Hg lamps should not be turned off and on at short intervals
- Remember to turn on the power supply (1-dual or 2-singles) on the front bench. This will provide ±9 volts to the photoelectric heads
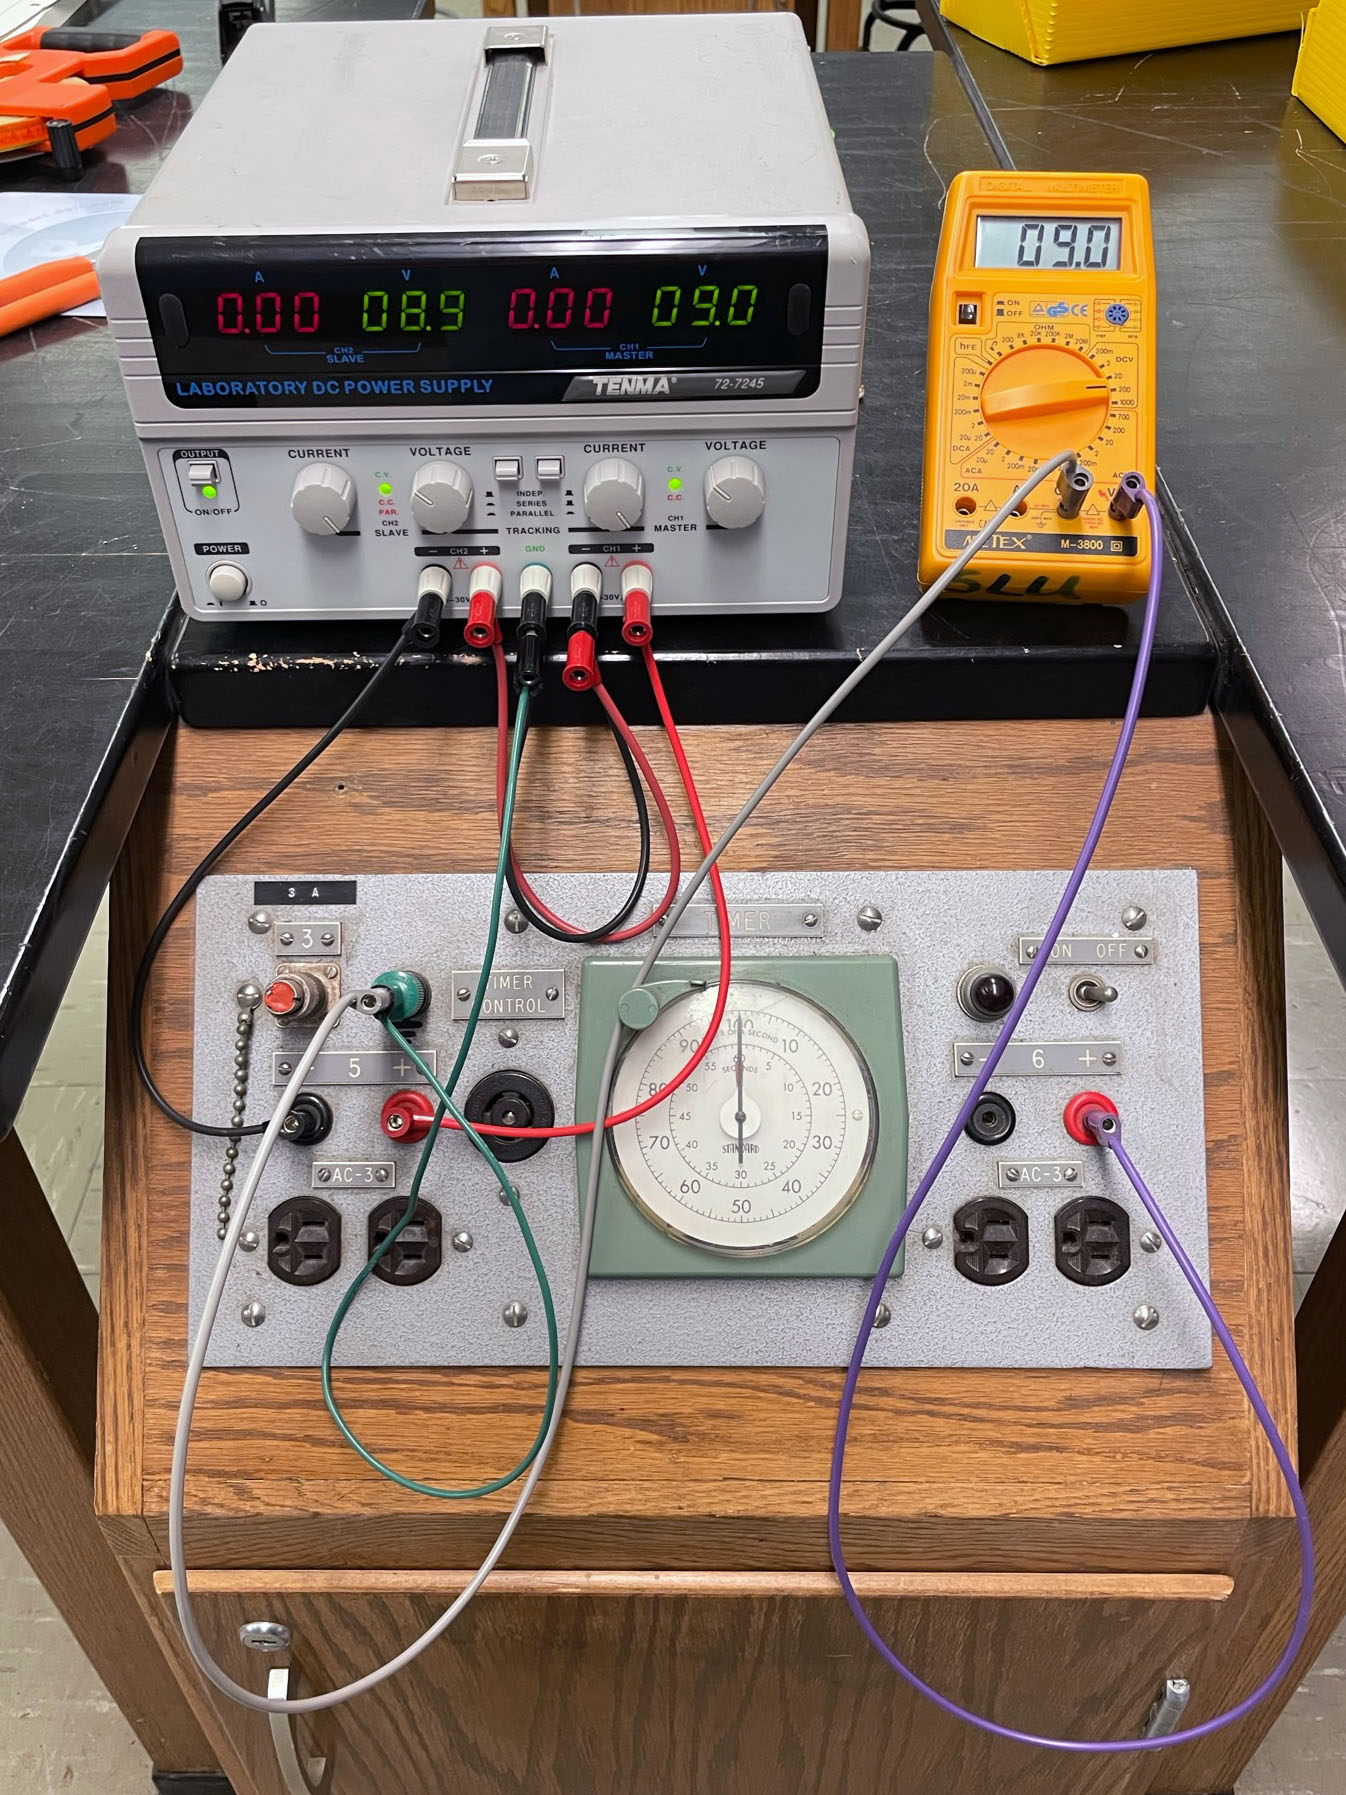
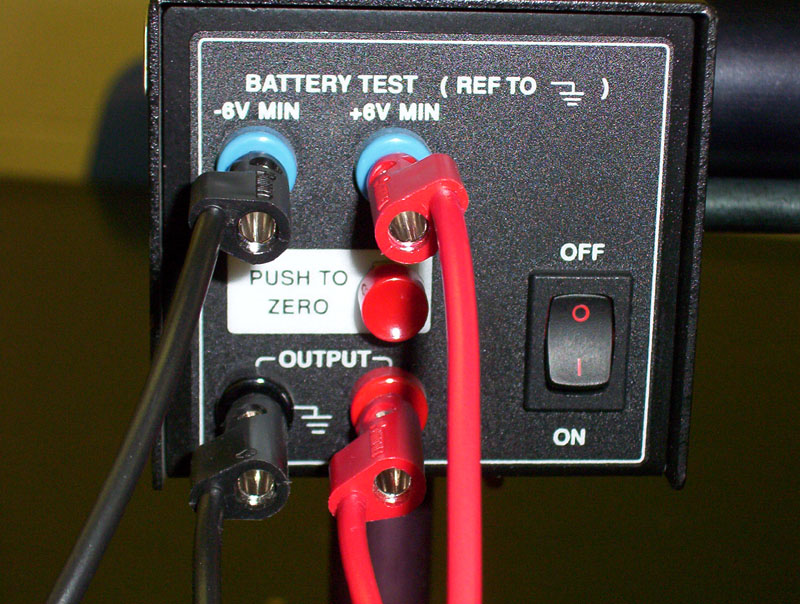
- Remember that the dual-power supply with digital readout shown in Figures 1 and 2 below has two buttons that need to be pressed: the main Power and the Output buttons
- The big power supply in the stockroom is used to distribute voltage to the lab benches from the lab power supplies. Instructions: Using the Flexlab Unit to Distribute a Fixed Voltage from an External Power Supply in Lab
- The circuit diagram for connecting a dual power supply (set to Independent) in the lab are found on the setup page.
- You can check the voltage settings following the procedure in Figures 1 and 2:
 |
 |
| Figure 1:
Set the positive voltage by connecting the positive lead of the voltmeter (purple wire) to the red connector on the power panel, and the ground lead (gray wire) to the green (ground) connector. Turn the right-side Voltage knob until the voltmeter reads +9.0 volts. |
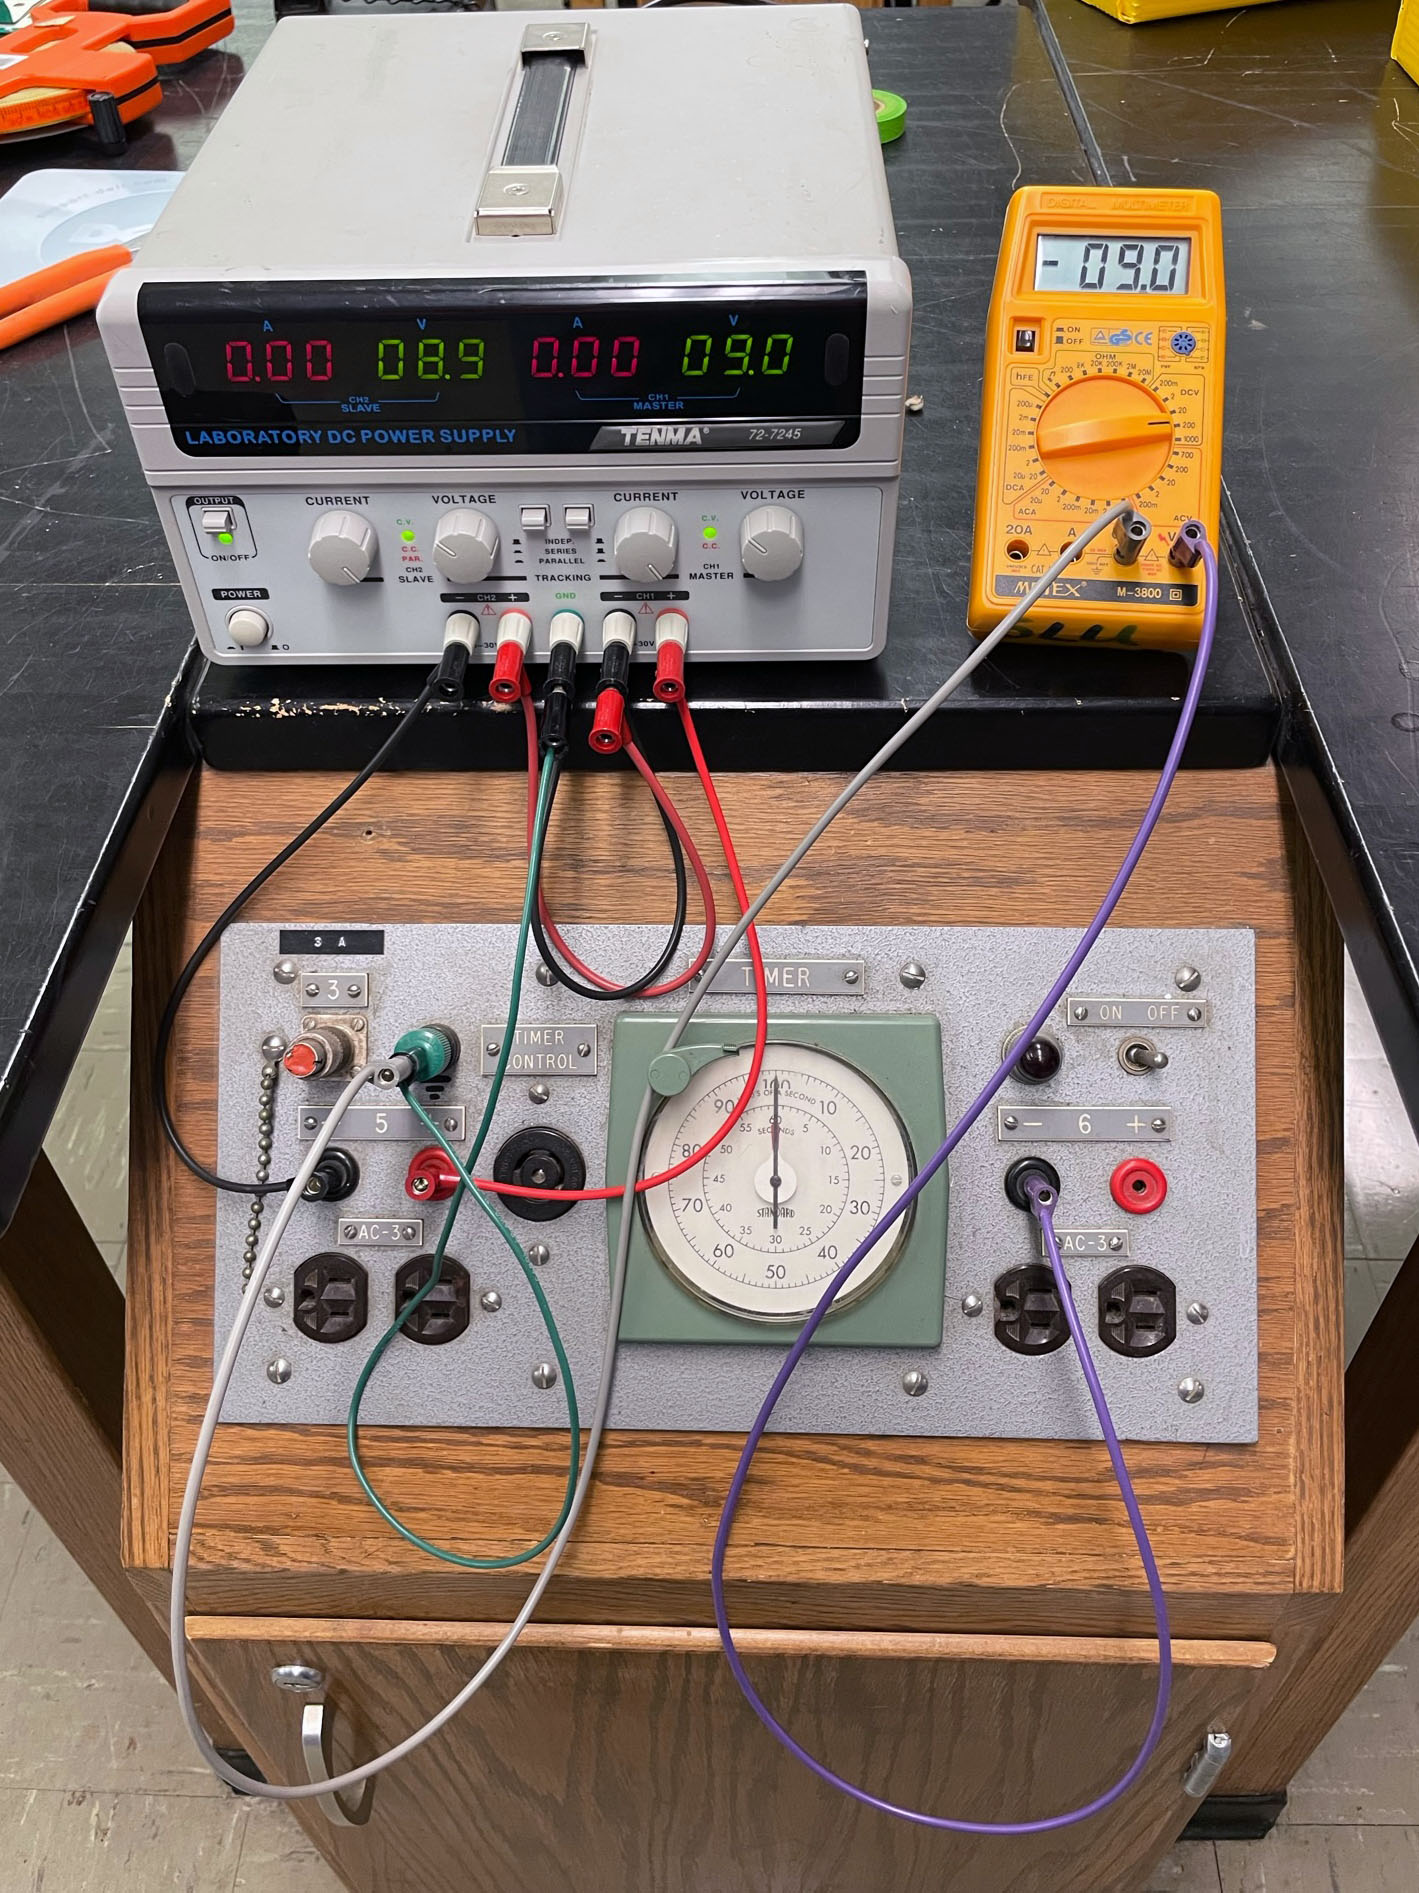
Figure 2:
Set the negative voltage by connecting the positive lead of the voltmeter (purple wire) to the black connector on the power panel, and the ground lead (gray wire) to the green (ground) connector. Turn the left-side Voltage knob until the voltmeter reads -9.0 volts. |
- Note that we do not ask students to show the origin of the eVstop vs f graph (I had to put this note here because we do ask for the origin in the Phys104 version of this experiment, and I can't remember anything anymore!)
- A summary of the results for each photoelectric head is found in Table 1 below. A more detailed Excel page with my data for every photoelectric head is found here; a printed copy of my entire spreadsheet is in the box with the extra photoheads. Since the results depend on the photohead used, the results below can be used as a reference to check that students have reasonable values.
- You should check students slope and intercept as soon as they have their first graph created. They are asked to check their results in the discussion, but if that happens at 4:05 pm and they have shit data, you'll regret not checking it earlier. They should get a slope around 4×10-15 eV·s and an intercept around -1.4 eV
- If they have shit data, check that they used the green and yellow filters. If their voltages for these two colors are around 0.7 or 0.8 V, then they likely did not use the filters *sigh* See Table 2 below!
- Jeff has another Excel spreadsheet that can be used to check student calculations. Select the photohead used, and enter student's slope and intercept. Results are compared to Miller's data. This was more critical when we still used Joules for energy units. Ask Jeff nicely for a copy of this spreadsheet if he hasn't already volunteered it.
-
Table 1: Photoelectric Head Results
| Photo Head |
h (eV·s) |
% Diff (h) |
W (eV) |
% Diff (W) |
Comments |
| A |
4.417×10⁻¹⁵ |
-7% |
1.628 |
-18% |
|
| B |
4.048×10⁻¹⁵ |
2% |
1.344 |
1% |
|
| C |
4.544×10⁻¹⁵ |
-9% |
1.793 |
-27% |
|
| D |
4.412×10⁻¹⁵ |
-6% |
1.625 |
-18% |
Difficult to see 'window'; Vstop > 2.0 V for Violet #1 |
| E |
4.122×10⁻¹⁵ |
0% |
1.454 |
-7% |
|
| F |
4.103×10⁻¹⁵ |
1% |
1.419 |
-4% |
|
| G |
4.210×10⁻¹⁵ |
-2% |
1.447 |
-6% |
Vstop > 2.0 V for Violet #1 |
| H |
4.161×10⁻¹⁵ |
-1% |
1.354 |
1% |
Vstop > 2.0 V for Violet #1 |
| I |
3.775×10⁻¹⁵ |
9% |
1.338 |
2% |
Vstop ~1.7 V for Violet #1 |
-
- Do the filters make a difference? Yes, and it affects some photoheads more than others!
-
Table 2: Vstop of Green and Yellow Lines, with and without filter
| Photohead |
Obs. Date |
Green w/o filter (V) |
Green w/filter (V) |
Yellow w/o filter (V) |
Yellow w/filter (V) |
| A |
04-17-2023 |
1.309 |
0.759 |
1.415 |
0.663 |
| F |
04-18-2018 |
0.877 |
0.828 |
0.851 |
0.708 |
-
- New - Spring 2019: I've added a section where students measure Vstop for one color through a transmission grating. Students will measure through each of the five sections of (100%, 80%, 60%, 40% and 20% relative transmission), and hopefully find that Vstop is the same in all cases. A plot of Vstop vs. % Transmission shows a flat relationship (when they follow the plotting directions given)
- Here's a copy of my Excel graph for Photoelectric Head G
- Again, check their graph as soon as it's created. It should be flat with little variation.
- Common problems: they forget to change the vertical axis or they plot the wrong eVstop column
- The photohead is aligned so that the light through the aperture on the white reflective mask falls directly upon the small 'windows' visible on the photodiode mask (when the light shield has been rolled to the 'open' position). These windows can be difficult to find on some of the photoheads, appearing near the top or bottom edge of the window to the photodiode mask. Pics:
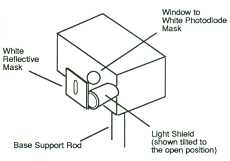 |
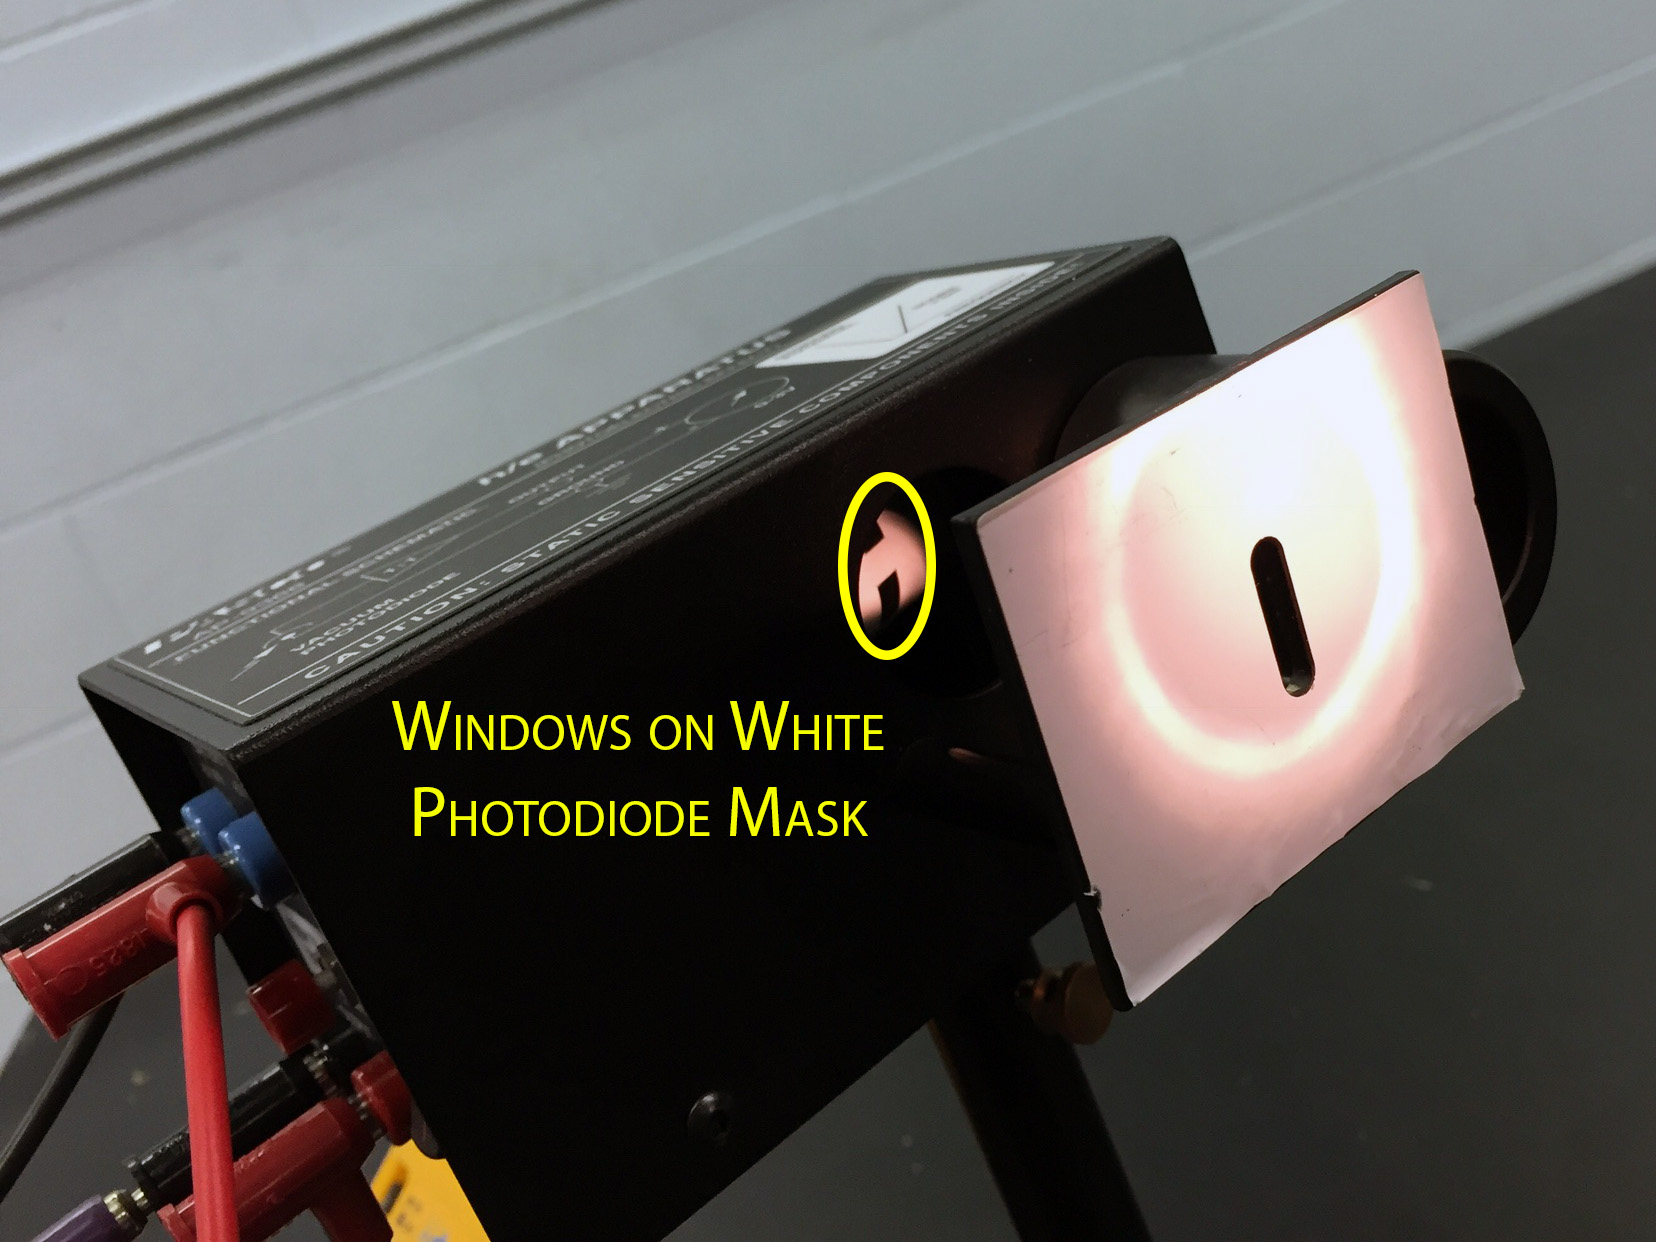
Click for a larger image
|
- Show students where the 'Zero' button is located on the photohead. There are 5 wires connected to the photohead, so they need to carefully press it without disturbing the wire connections or alignment:
 |
|
- Students only measure the first order images on the side of the photohead with the wires; they will pull the photohead towards them to view these brighter lines
- Pre-Lab Notes:
- When showing students apparatus function during the pre-lab, ask them to look at the list of wavelengths given, and see if anything there 'bothers' them.
- Better students will realize that the first violet line, at 365 nm, shouldn't be visible. If none figure this out, prompt them by asking if they know the range of wavelengths for visible light (many will know that it's 400 – 700 nm)
- Why can you see the UV line at 365 nm?
- From Pasco's Instruction Manual: "The white reflective mask on the h/e apparatus is made of a special fluorescent material. This allows you to see the ultraviolet line as a blue line, and it also makes the violet line appear more blue. You can see the actual colors of the light if you hold a piece of white non-fluorescent material in front of the mask. (The palm of your hand works in a pinch, although it fluoresces enough that the UV line will still be visible.)"
- Demonstrate actual line appearance using a piece of cardboard (e.g. from a pad of graph paper) as shown in images below. Pieces of cardboard can be found in the non-Major's stockroom, shelf NN3
- Also remind them that the green and yellow filters are used on the green and yellow lines only. Don't be surprised if several still forget *sigh*
- Many are confused about which 'green line' they should measure. They should use the sharply defined, bright green line, not the diffuse (and barely discernible) green smear
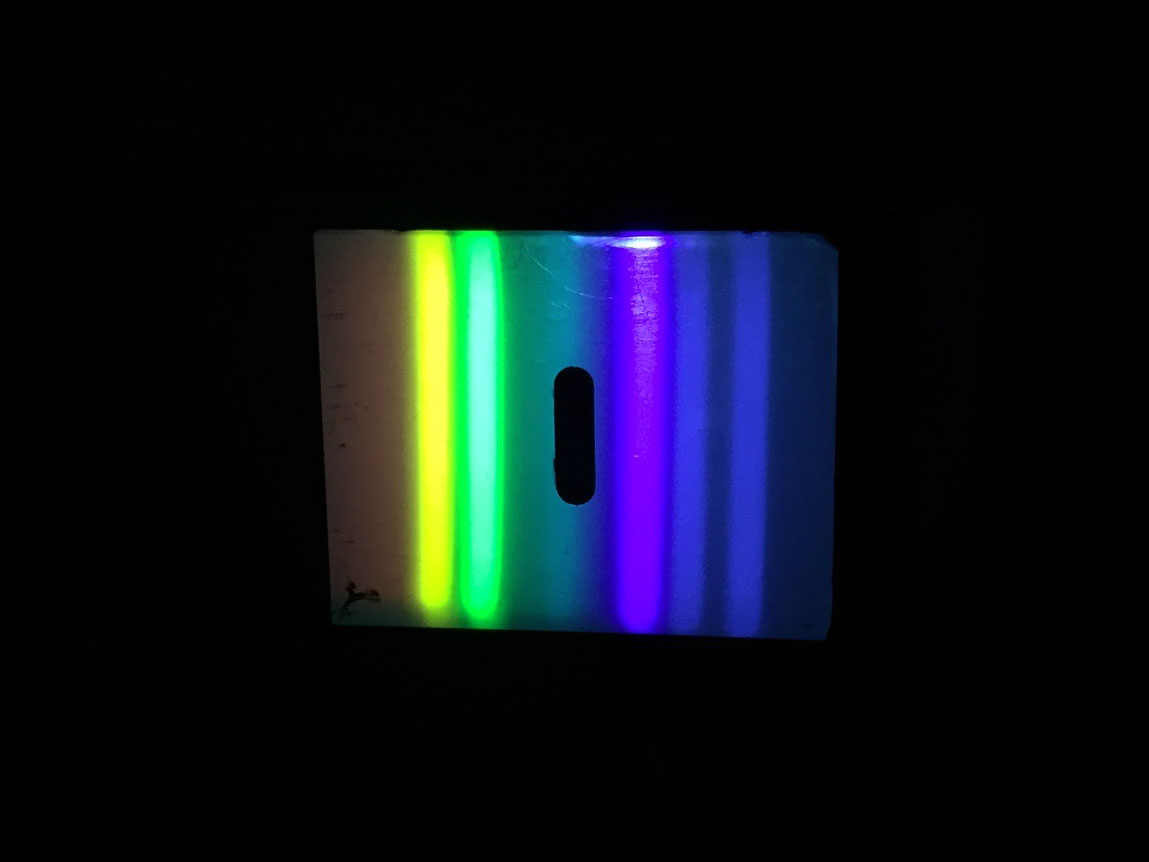
The mercury spectrum on aperture mask:
(R-L) Violet #1, Violet #2, Blue, Green, Yellow |
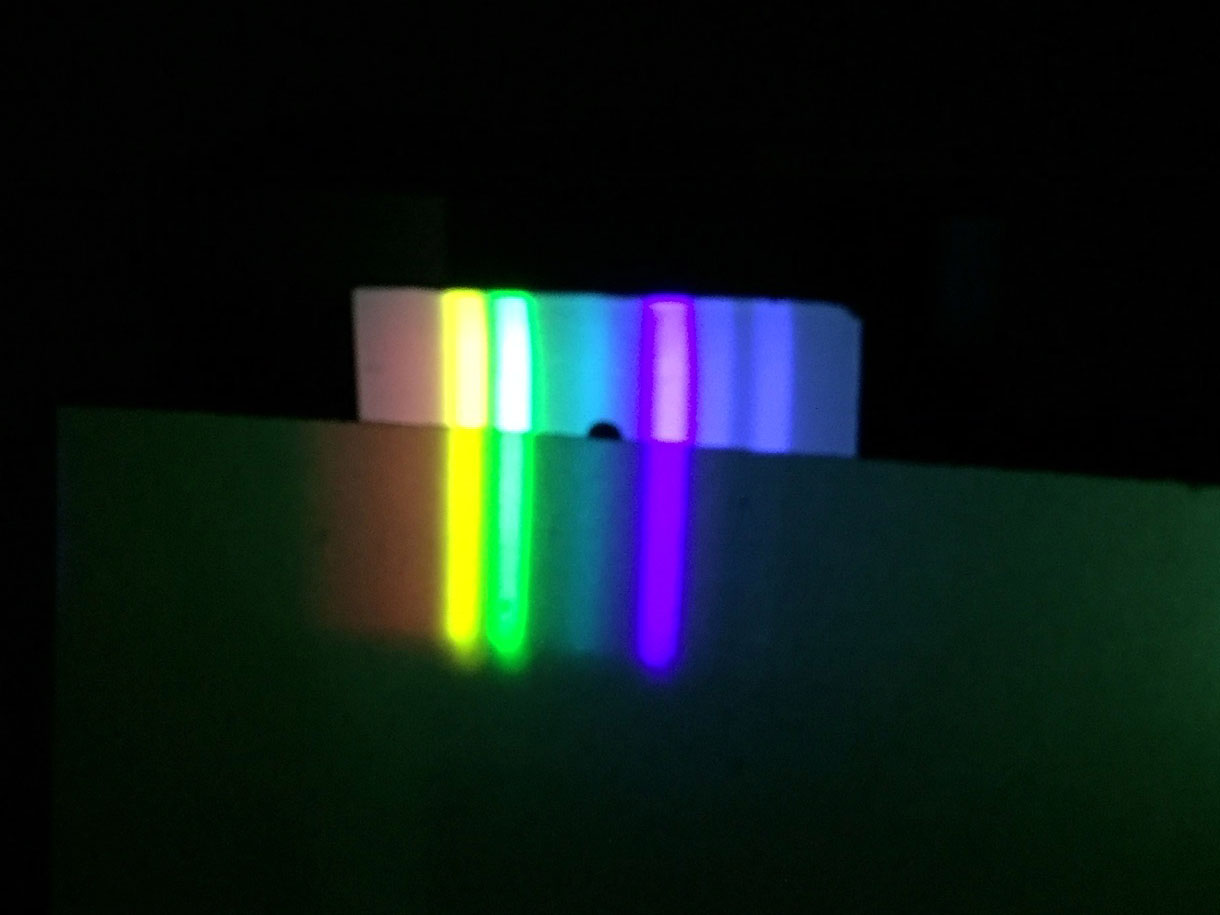
Cardboard held on the lower half of mask does not
fluoresce,
so the violet lines are not visible |
- When everyone is finished, tip over all the flashlights and turn off multimeters. Students will frequently leave them turned on and place them face-down on the bench, draining the batteries
- Historical Notes:
- The following text used to follow the table of wavelengths in the instructions: "The yellow line is actually a double line of wavelengths 577.0 and 579.1 nm; you will be able to resolve it as a single spectral line only." This only confused students, and doesn't add to the experiment at all; weak students use it as a cause of uncertainty, so I've removed the line
- We used to calculate the energy in units of Joules. That was too confusing for students, so we now use electron-volts. The following note is no longer relevant but kept for historical hilarity:
- "The slope of their line gives h/e, and the intercept (-W/e). They need to be reminded (over and over) that the uncertainty is also multiplied by the charge on an electron, e. Figuring out the equivalent units will flummox weaker students, since they don't remember that J = C·V:"
- Slope units: {V/Hz = V/(s-1) = V·s}. Since h = slope·e, units: {V·s·C = J·s}
- Intercept (b) units are V, and W =-b·e, so the units: {V·C = J}
- Common mistake: they will press the e button on their calculator, instead of using the charge on an electron (facepalm)
|