Natural Capital Project, Lead Software Developer Interview - Rich Sharp
A large portion of my professional career has been spent developing scientific software for biologists, geneticists, biochemists, and statisticians.
Formally, my training is in numerical methods as applied to computer graphics. Many of my scientific collaborations have benefited from understating numerical techniques and being able to present data in a visual form. I highlight some of these below.
My recent collaborations have involved GIS work, browser based applications, and cluster computing all of which are applicable to developing the InVEST tool.
Recent projects where I have been lead developer include:
- GIS tool to visualize and analyze army ant movement and bird foraging patterns in Amazonian rain forest.
- Development of online database of statistically significant DNA features in S. cerevisiae related to gene regulation. Included a high performance Monte Carlo generation of synthetic S. cerevisiae genomes for statistical significance tests.
- A web-based implementation of a bootstrapping analysis tool for teaching undergraduate statistics.
- 3D simulation of light scattering in human tissue for a medical equipment startup company that used infrared light to image internal arteries in real-time.
Below I highlight the following topics
Past Role as a Lead Developer Back to top. ↑
In this section I highlight an early project that I assumed the lead role in, including the development and maintenance of a computational pipeline and toolkit to analyze 3D pathological differences between wildtype and retinoblastoma deficient mouse placenta. I selected this project because of several similarities between it and InVEST, namely:
- Majority of the team was made up of scientists from different backgrounds, not primarily computer science, and separated by large physical distances.
- Mathematical models came from a variety of disciplines.
- Before my involvement, an informal code base was written by several graduate students.
- Took over in the middle of the project, formalized development pipeline and oversaw its completion and maintenance.
This project helped me refine what designs work well in an academic programming environment. When starting a new project I often reflect on this project drawing lessons from what worked well and what didn't. I discuss some of this in my vision for InVEST below.
- Project overview.
- Contributions as lead developer.
- User needs and interfaces.
- Platform and language selection.
- Releases.
- Workflow.
- Lessons learned.
Overview of the Project Next section. ↓
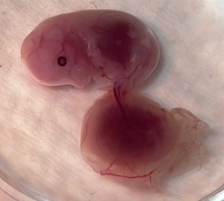
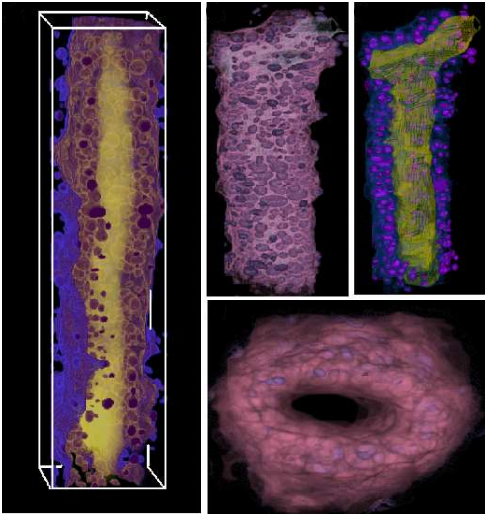
The biological focus was to study the regulatory effects of the retinoblastoma (Rb) gene in mice, specifically how the gene affects the development of the placental tissues as a complete organ. Previous studies had pertained to effects at the cellular and gross level, but none had been done quantifying physical changes at the level of the entire organ.
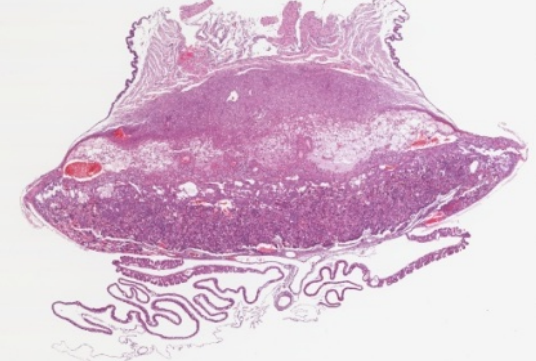
At the biological level, placenta were harvested and mounted in paraffin, divided into 500-1500 slides and scanned with a high resolution microscopy imager. This step was laborious and one of the initial challenges of the project. The result was a dataset of high resolution images, similar to the one on the right that made up the original placenta.
Challenges:
- The dataset provided to us was a set of microscopy slides taking terabytes of storage space. At the time a large amount of RAM was 1 gigabyte. Even single images were measured in gigabytes requiring us to process them in pieces.
- Original images were noisy and unaligned. The challenge was to realign the images in the original orientation of the organ. The task was equivalent to reassembling a film strip that had been cut into frames, scratched, and oriented in random directions.
- On the software side, developers didn't understand the scientific question, let alone the domain. The end product was unclear, yet people were working on it.
Results:
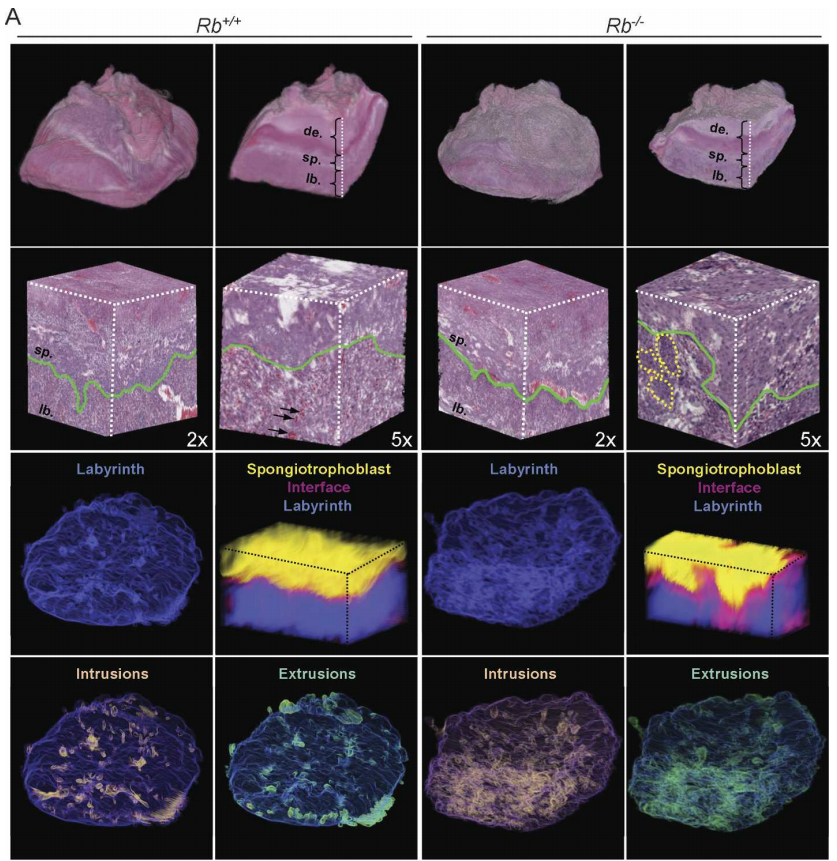
- We developed a reliable workflow software pipeline for processing raw data, generating 3D visualizations and quantifications and was robust enough to be used on two additional datasets.
My Contributions as Lead Developer Next section. ↓
I was introduced to this project for the purpose of developing a 3D visualization tool. Over time, I assumed the lead developer role on the software side, organized the development pipeline and acted as the primary intermediary to the geneticists.
User Needs and Interfaces Next section. ↓
To gain an understanding of the underlying scientific questions, I read the literature produced by the human cancer genetics group. Later I met with the primary scientist and later assisted her in the lab. This experience defines much about how I develop software. Immersing myself in the problem domain not only helps me learn the domain jargon but allows me to understand what the users need in their software. Good software cannot be developed independently of its context.
One of the challenges of developing user requirements is that what the users think is hard is often easy, and what they think is easy is hard. The challenge is to identify what the user really wants, and find possible alternatives to the hard stuff.
As the project developed we identified two end products:
- 3D Visualization
- Physical Quantification
User interfaces were designed primarily by asking the scientists what they need to answer their questions. We would then build prototypes, and run informal usability tests during each bi-weekly meeting. As the project progressed scientists became comfortable downloading updates through the repository and often provided us feedback remotely.
Platform and Language Selection Next section. ↓
Before I arrived, the parts of the pipeline that had been developed were written in bash scripts and Matlab. We later added C++ for the image processing, 3D visualization, and quantification. We chose C++ as it easily integrated with several libraries we intended to use:
- ITK: The Insight ToolKit developed by Kitware which had many image processing algorithms already in the library. We later added additional routines by extending the existing library.
- OpenGL: We chose to use the Open Graphics Library to display the actual 3D visualization as it was an open source platform and we had expertise in the team.
In terms of platforms, we developed much of the image processing pipeline on Linux since the primary infrastructure available to us were Linux machines. The geneticists were familiar with Windows, so we developed the 3D visualization in Windows.
Releases Next section. ↓
Releases were handled through a CVS repository. Working builds were checked out by co-developers. For each working implementation, we would roll a binary for scientists to download off the project site. Over time some of the scientists also used the repository system for updating the quantitative and 3D visualization tool. Once development was in full swing, releases were generated bi-weekly to coincide with project meetings.
Development of Workflow Next section. ↓
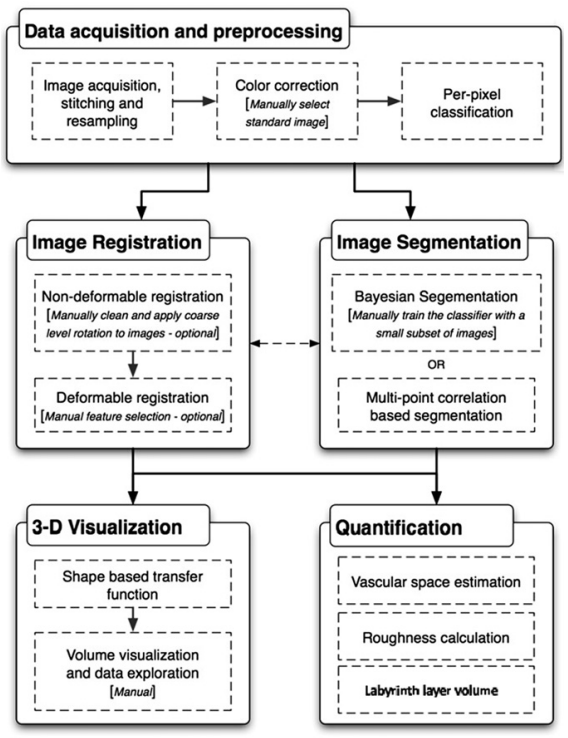
The figure to the right shows our final pipeline. I'll highlight some key design decisions.
- How should data be processed (manual steps, or automatic)?
- How will programmers working on separate parts collaborate?
- How to share results and get feedback from scientists?
Lessons Learned Next section. ↓
Communication between developers and users changes everything. An effort on the part of the developers to understand the scientific problem at hand, rather than focus on implementation, results in a higher quality product and builds trust across the team.
Investing effort into a one step build would have been a good idea. During several time crunches we would need to make changes to the system, then go through a complicated multi-part build step.
The lack of a bug reporting system was frustrating. Several pieces of the system developed some "bug lore" that commonly caused problems. In retrospect, bugs should have been fixed before new features were developed.
A measure of success is if the software is used. After the placenta project was complete this tool was used to image mouse mammary ducts with the same workflow. Results of that project are shown to the right. Recently it was used to image mouse neurons.
Preliminary Vision for InVEST Back to top. ↑
I recommend that the project focus on:
- defining the needs of government officials, conservation professionals, farmers, and other land owners in regards to making land use decisions based on the future costs and benefits to the people and environment, and
- transition to a platform to maximize the accessibility of InVEST to the targeted audience.
In the short term I would spend time getting a handle on the code base, identifying known issues including defects and runtime inefficiencies.
Next I'll discuss following topics related to a preliminary business plan:
- Architecture
- Language Selection
- User Interface
- Incorporation of Existing C and Fortran Modules
- Project Management
Architecture Next section. ↓
Promoting accessibility (getting it and using it) supports the mission of the InVEST tool by expanding its user base and usefulness. Currently ArcVIEW runs a price tag of $1500-$3500 and is a general purpose GIS tool; taken together these restrictions eliminate many casual users. I suggest moving away from the ArcVIEW platform and exploring online or open source desktop alternatives. Below I list some suggestions ranked approximately by accessibility:
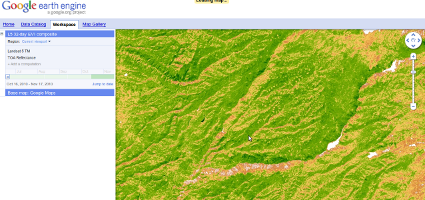
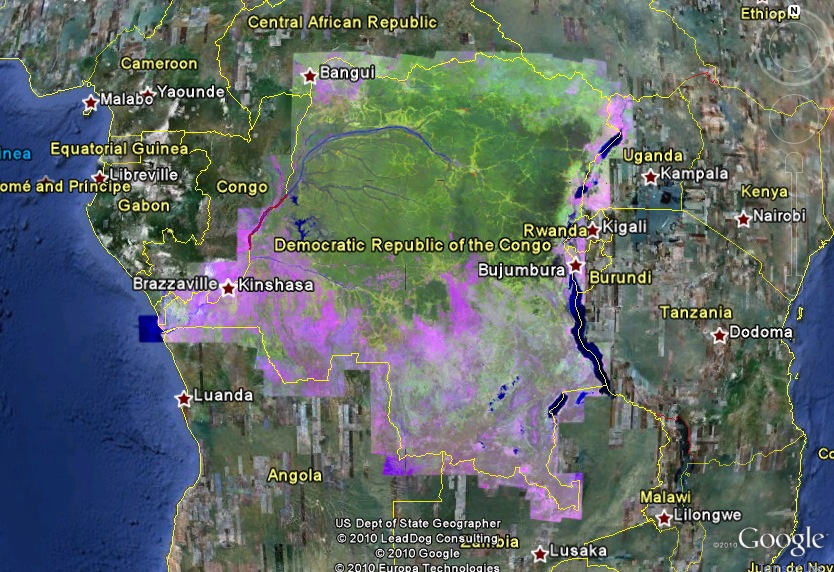
- Google Earth Engine High degree of control over user interface. Can use data stored on Google's servers, thus mitigating the need for the user to have a local copy of dataset. An interesting possibility is that computational models could be executed on Google's cloud. A possibility is that models could be pre-computed and stored on the server, or at least computed in real time with more power than a desktop. In the long term, would likely require reimplementation of current models for parallelization.
- Google Earth plugins Computation on user's computer. Would simplify incorporation of current models, but put the weight of computation on the user's desktop.
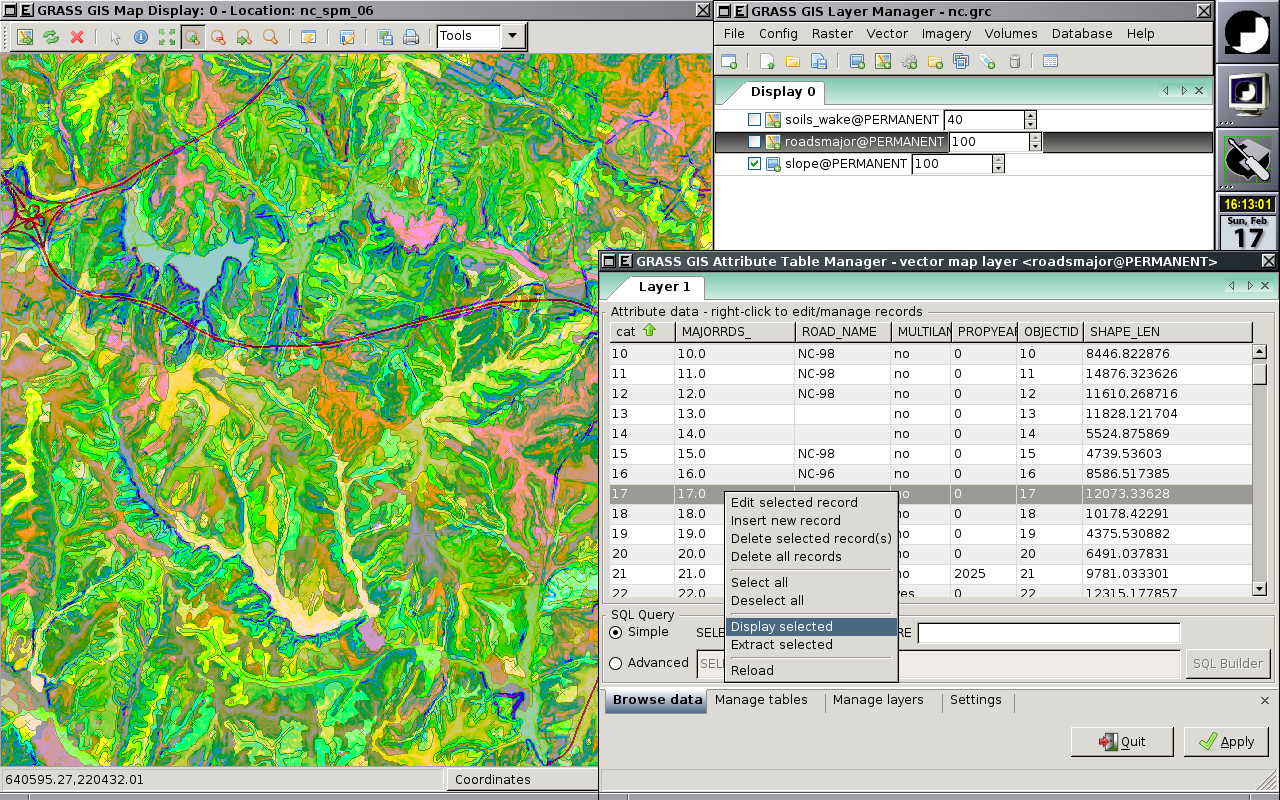
- Desktop alternatives like GRASS GIS. Free/open source and similar work environment as ArcVIEW but would require uses to go through an installation step. Likely simpler implementation as interfaces would be expected to be similar to ArcVIEW. I would recommend customizing it as a standalone InVEST tool, rather than plugins to GRASS GIS; a model commonly used by several open source development tools.
Language Selection Next section. ↓
Large projects often use several different languages. Selection will depend on the direction the architecture takes. For example, partnering with the Google Earth Engine will likely require interfacing with Python and Java. Below I detail the likely language types that will be used in continuing the development of InVEST.
- Python is an expressive language whose programming style focuses on behavior rather than interface adherence. Part of the power of the language exists through the availability of a massive number of libraries. Python is not a language for CPU intensive tasks, but it has mechanisms to interface with code written in other languages that are amenable to high computational performance. Python is expressive but must be carefully designed for large projects. Commonly used for prototyping and patching together modules written in other languages.
-
Java is a good language for large scale systems that focuses abstractions through interfaces and packages. The standard libraries have excellent data structure implementations. The language has abstraction mechanisms that support good designs. The compiler enforces design constraints and can help expose design errors early in development. If used correctly, this can yield good modular designs. It has an excellent built in documentation framework (JavaDoc) and is amenable to distributed computation if multiple CPUs or computers are available.
Often Java code is "wordier" than its Python equivalent. However, much of the extra syntax is meant to ensure code developed conforms to a global interface and helps to identity design errors at an early stage. Modern Integrated Development Environments (IDEs) like Eclipse help to automate much of the extraneous syntax.
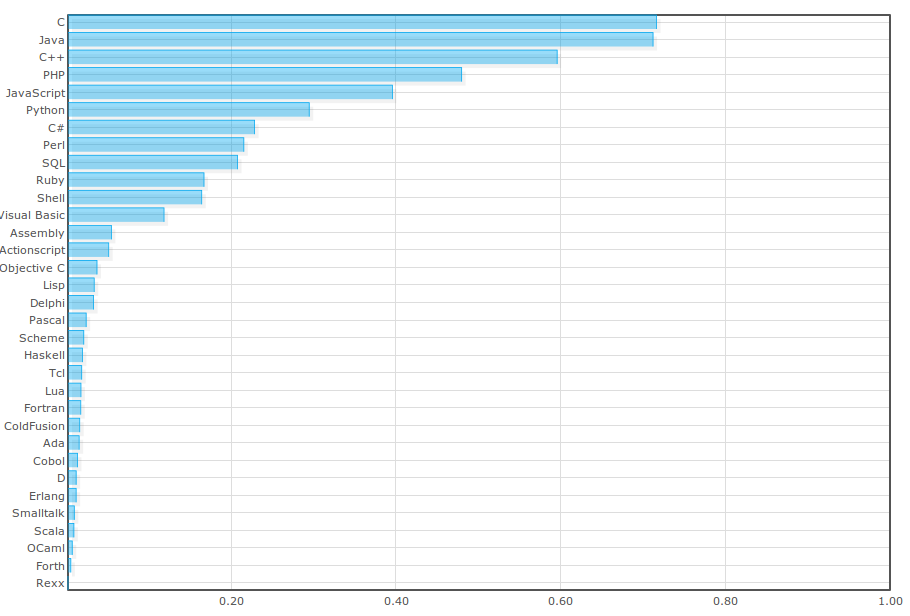
- C, C++, Fortran: Useful for high speed low level numerical computation, although in many cases Java outperforms or performs at the same level as equivalent code written in these languages. If the architecture is GRASS, C might be used as a primary language to build extensions for the tool.
- JavaScript is a language that is mainly used to control web browsers. If the InVEST architecture goes into a web browser, JavaScript will be used to interface with the plugin and implement the user interface. A subset of the language can rival that of Python in terms of ease of coding and expressiveness. Most of Google's application framework is built with JavaScript in the browser and Java, C++, and Python on the server side.
User Interface Next section. ↓
As stated on the InVEST website, the primary users for the tool are "government officials, conservation professionals, farmers, and other land owners". It's likely many of these users are not familiar with GIS tools. Thus, to promote usability, the user interface must be approachable yet allow for advanced features for the experienced user.
The user base makes an excellent justification for a browser based tool. People who use computers can use a web browser. The range of possibilities given modern JavaScript libraries is large.
Controls need to be intuitive and meet the needs of the primary users. This must be assessed and developed by working with potential users of the tool. Defining use cases also help to realize what controls are necessary. For example, consider a farmer considering the costs of clearing a forested region of land for cultivating. Which section and how much should be guided based on likely gains in production contrasted with long term costs to the surrounding environment and inhabitants. Consider a potential use case:
- Go to the InVEST website.
- Zoom in on the region of interest.
- Draw on the map with the mouse indicating the region to clear.
- See a visual representation of the area affected, as well as a numerically quantified data set with confidence estimates on potential benefits and costs.
A more advanced user may use the tool differently:
- Upload a custom dataset reflecting known distribution of an oil spill.
- Link to an existing dataset of ocean currents.
- Upload a plugin module that calculates oil dispersion given current flow.
- Overlay the result of that analysis over known kelp forests.
InVEST should support both casual and advanced users by making commonly used functions easily accessible, while still supporting advanced usage.
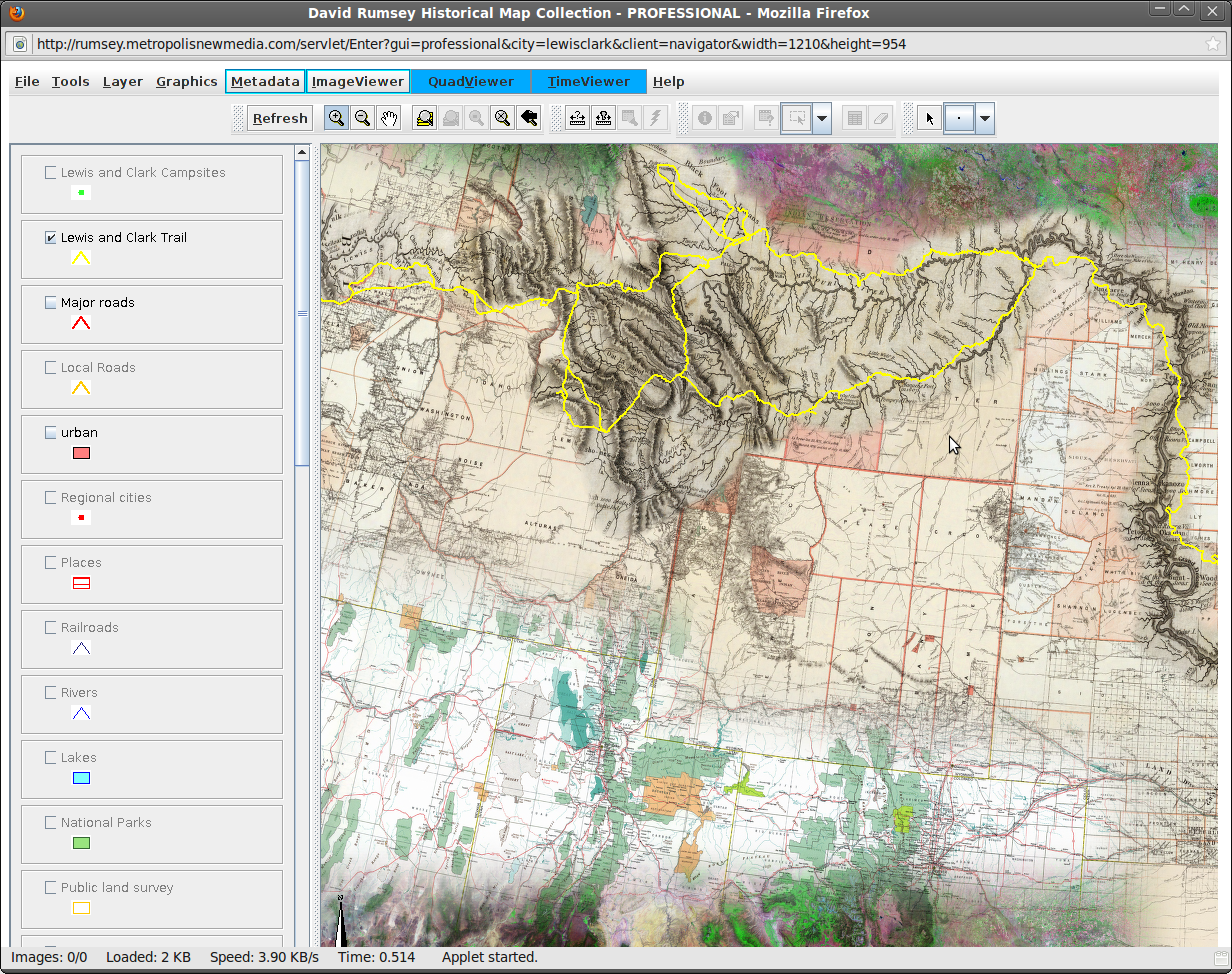
The image to the right shows an online historical map browser for the Lewis and Clark expedition. Its interface reflects this quality. Novices to experiment with the dataset while advanced functions are hidden in menus. The following references are also inspirational to user interface design:
Incorporation of Existing C and Fortran Modules Next section. ↓
Whether the focus is on a desktop or web based environment, the computational engine will be implemented in Python, Java, or C. All of these languages can work with existing C and Fortran libraries.
- Python:
- Python has a C API that provides access to the Python run-time system.
- There is a well developed Python package called numpy which is developed in Fortran. It supports
fast numerical calculations by calling Fortran libraries.
It also has a tool
F2PYwhich allows developers to build an interface to low level Fortran code.
- Java: The Java Native Interface (JNI) is a Java feature specifically targeted for the incorporation of native code written in C, Fortran, and other languages into a Java process.
- C: Existing libraries implemented with C will
trivially integrate while Fortran libraries can be
integrated with the
externdirective.
Project Management Next section. ↓
As the lead developer for InVEST I would first spend time with the codebase to understand the structure of the current system. Simultaneously I will develop a professional software development workflow that focuses on producing high quality software. I highlight some main points below.
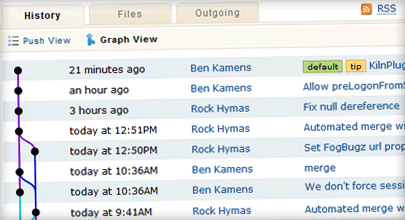
- Ensure the project is under some form of source control, my preference being Mercurial. This tool allows programmers to keep track of changes to the software over time and revisit any changes, or even take experimental forks that can be later merged with the project, discarded, or developed separately. If the project is open source, code can be hosted on a public repository like Google Code, GitHub or in-house. Hosting on a public site will increase visibility of the project.
- Ensure the tool can be built in one step. This helps with several issues, the tool can be built once a day, say at lunch, and if it's broken the developer can fix it in the afternoon. When deadlines approach it is easy to make a change and rebuild the tool. I learned this lesson with the mouse placenta analysis tool I described earlier. We could have been many times much more productive during deadlines if we implemented this in an early stage, instead we spent valuable time making changes and going through several build steps.
- Track bugs in a database, public if it is open source, and fix bugs before new code is developed. Bugzilla is an excellent tool for this. It is easier and less costly to fix bugs early in the development cycle. Additionally, it allows the tool to be released as a new update at any time.
- Maintaining a schedule and estimates about developer productivity will allow the team to mature and deliver realistic estimates and provide feedback to users about the status of the tool. Evidence Based Scheduling is a good example of this.
- Automated test cases should be developed and included as part of the build. As any change is made to the code base, the test cases are constantly being re-run to make sure nothing is broken. Whenever a bug report is made and the bug is fixed, a test case is added to the suite that would have identified that bug.
- If using a web based tool, releases will be transparent to the end user. Otherwise, releases will be announced as part of a public website to include a binary and current reversion control number. In the case of a desktop tool, I recommend developing Linux deb and rpm installation packages for easy distribution to Debian and RedHat based Linux systems.
Questions? Back to top. ↑
Thank you for your time. I'm happy to answer any questions.
References Back to top. ↑
- InVEST User's Guide
- Placenta Project Publications
- Reconstruction of Cellular Biological Structures from Optical Microscopy Data.
- An Imaging Workflow for Characterizing Phenotypical Change in Terabyte Sized Mouse Model Datasets.
- Detection and Visualization of Surface-Pockets to enable Phenotyping Studies
- Volume Rendering Phenotype Differences in Mouse Placenta Microscopy Data.
- Rb is critical in a mammalian tissue stem cell population.
- Possible Architectures:
- User Interface Inspiration: