- Computers are NOT needed for lab this week
- Turn off H-bulb when not in use! It will extend the lifetime of the bulb
- Note that it might take a long time (~1 to 2 minutes) for the hydrogen bulb to turn on. Patience is a virtue (and in short supply at this time of year)
- Grating weirdness:
- One of the gratings makes the zeroth-order image of hydrogen look blue. I collected data, and checked student data with this grating and you still get very good results. No clue why this happens, but I have a sticky note in the box with this grating
- The Hγ (violet) line is difficult (but not impossible) to see on one side with two of the gratings. I've marked those and ordered new gratings, so they won't be used
- There is a note on the board telling students not to mess around with the spectrometers until shown their operation. Aligning the spectrometers is very time consuming! It takes me around 3 to 4 hours on the weekend to get the spectrometers aligned and ready for use!
- You probably won't need it, but the manufacturer's instruction manual for the spectrometers is kept with
the spectrometers, and usually moved to the instructor's bench during lab. They provide detailed – if not entirely
understandable – instructions for aligning the spectrometer. I created this document (updated 14 April 2023) which has more explicit instructions and photos. A copy of my instructions are also kept with the spectrometers.
- The spectrometers are heavy (~12 kg = 26 lbs.), so be careful if you have to move them
- Tell students wearing baseball caps to take them off or reverse them (as a true Larry should); they'll hit the grating or the telescope with the brim and knock it out of alignment
- The students goal for today is to finish sections I through III. Part IV can be done next week, but I tell them that they can finish it on their own, and not have to show up the following week
- Some will take advantage of this, others won't. You might have the whole class show up, or nobody. It's a crap shoot!
- Note that nothing gets handed in this week, so you have a week off from grading lab reports. It's these little victories that keep me going
 I spend a few minutes during the pre-lab going over the operation of the spectrometer. Despite the fact that I have added very specific instructions about which knobs to twiddle during measurement, someone will still manage to screw it up! I spend a few minutes during the pre-lab going over the operation of the spectrometer. Despite the fact that I have added very specific instructions about which knobs to twiddle during measurement, someone will still manage to screw it up!
- Before each lab section, I will make sure that each spectrometer is properly aligned. After explaining the parts of the spectrometer, I have students turn on the hydrogen bulb and spectrometer light source, and turn off the room lights so that each student can see the bright green cross. When they put the grating back on the stage, the grating needs to be turned until the bright green cross is centered on the vertical cross-hair
- Despite the fact that it is clearly explained in the instructions, some will still freak out that the green cross is not centered in the field of view. *sigh*
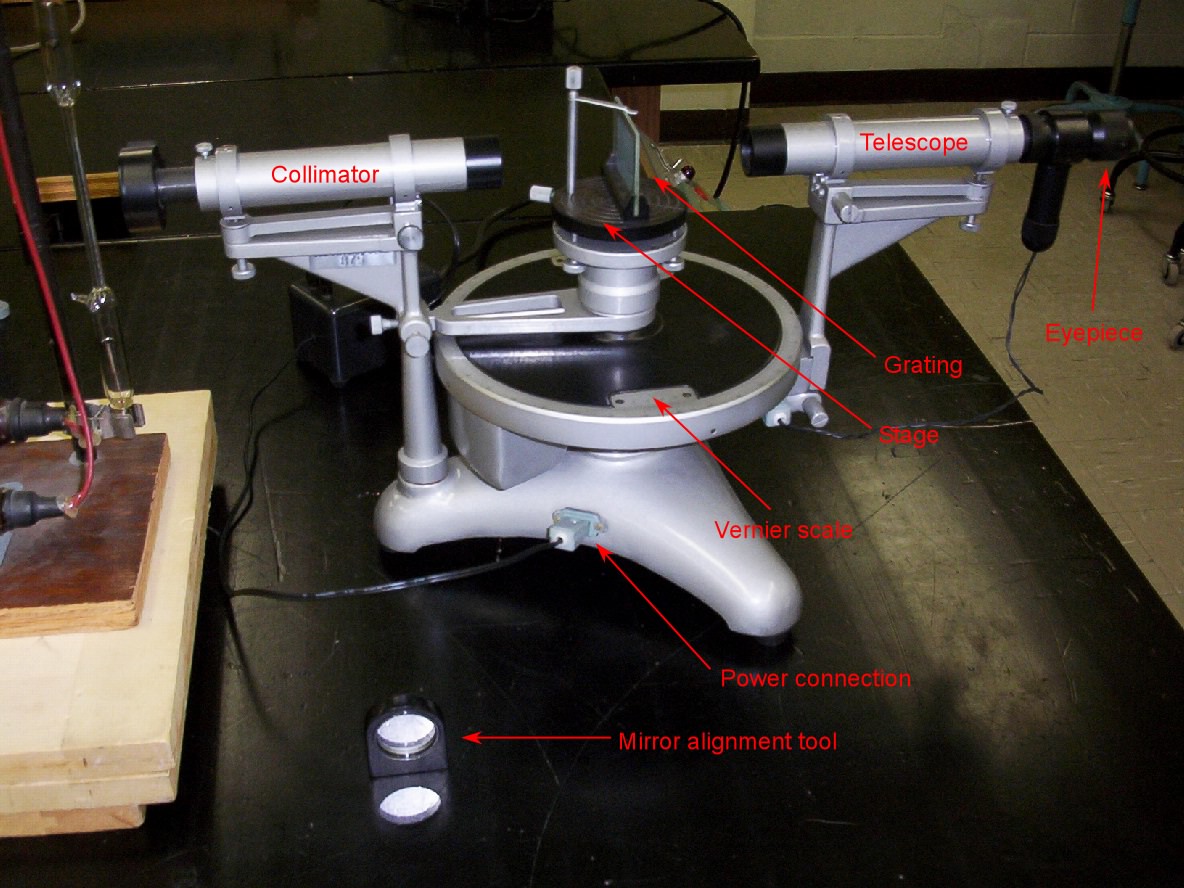
- An annotated photo of the spectrometer that is used appears at right. It's an old photo; take a look at the hydrogen tube power supply on the left side! See also the photo details page for more images
- The room lights are left on in the lab for parts I (Calibrating the grating) and II (Setting up the Spectrometer, Practice Reading Vernier Scale). They must be turned off for part III (actual line measurement). Tell students that the lights will be turned off no later than 3:00 pm!
- When calibrating the grating, align the diffraction grating perpendicular to the laser beam so that there is no more than 0.5 cm difference between the distances of n = ±2
- It is important that students first align the laser so it is perpendicular to the wall, and then align the grating perpendicular to the laser
- While holding a small plane mirror against the wall, the laser is perpendicular to the wall when the beam reflects directly back upon itself. Figure 1 shows that small pieces of cardboard can be used to elevate the front or rear of the laser to help with alignment
- When the grating is perpendicular to the axis of the laser beam, a reflected beam will be reflected back onto itself. As a first approximation, very carefully observe the reflection of the zero-order beam and rotate the grating so that is aligned correctly (Figures 2 and 3). Fine tuning can then be done from the measured distances of the ±2 images
- Some students just cannot get the correct d for their grating. If they don't have it by 3:00 pm, give them the published value to use for the rest of their calculations (make sure they have the correct d for the grating they're using!)
- Laser setup for grating calibration:
- The spacing of n = ±2 makes it impossible to set up more than 5 lasers in the lab at a time (Figure 4). If more lasers need to be used, send them to the Astro lab (Bewkes 232), which hopefully isn't being used (Figure 5). The maps below show the setup
- Take note of the approximate positions of the lasers (see the map on the Setup page and the photos on the Details page). If the lasers are too far back from the wall, the hydrogen tube power supply or spectrometer may interfere with the projection of the image. It's ok if the tube power supply needs to be moved, but the spectrometer should not be moved!
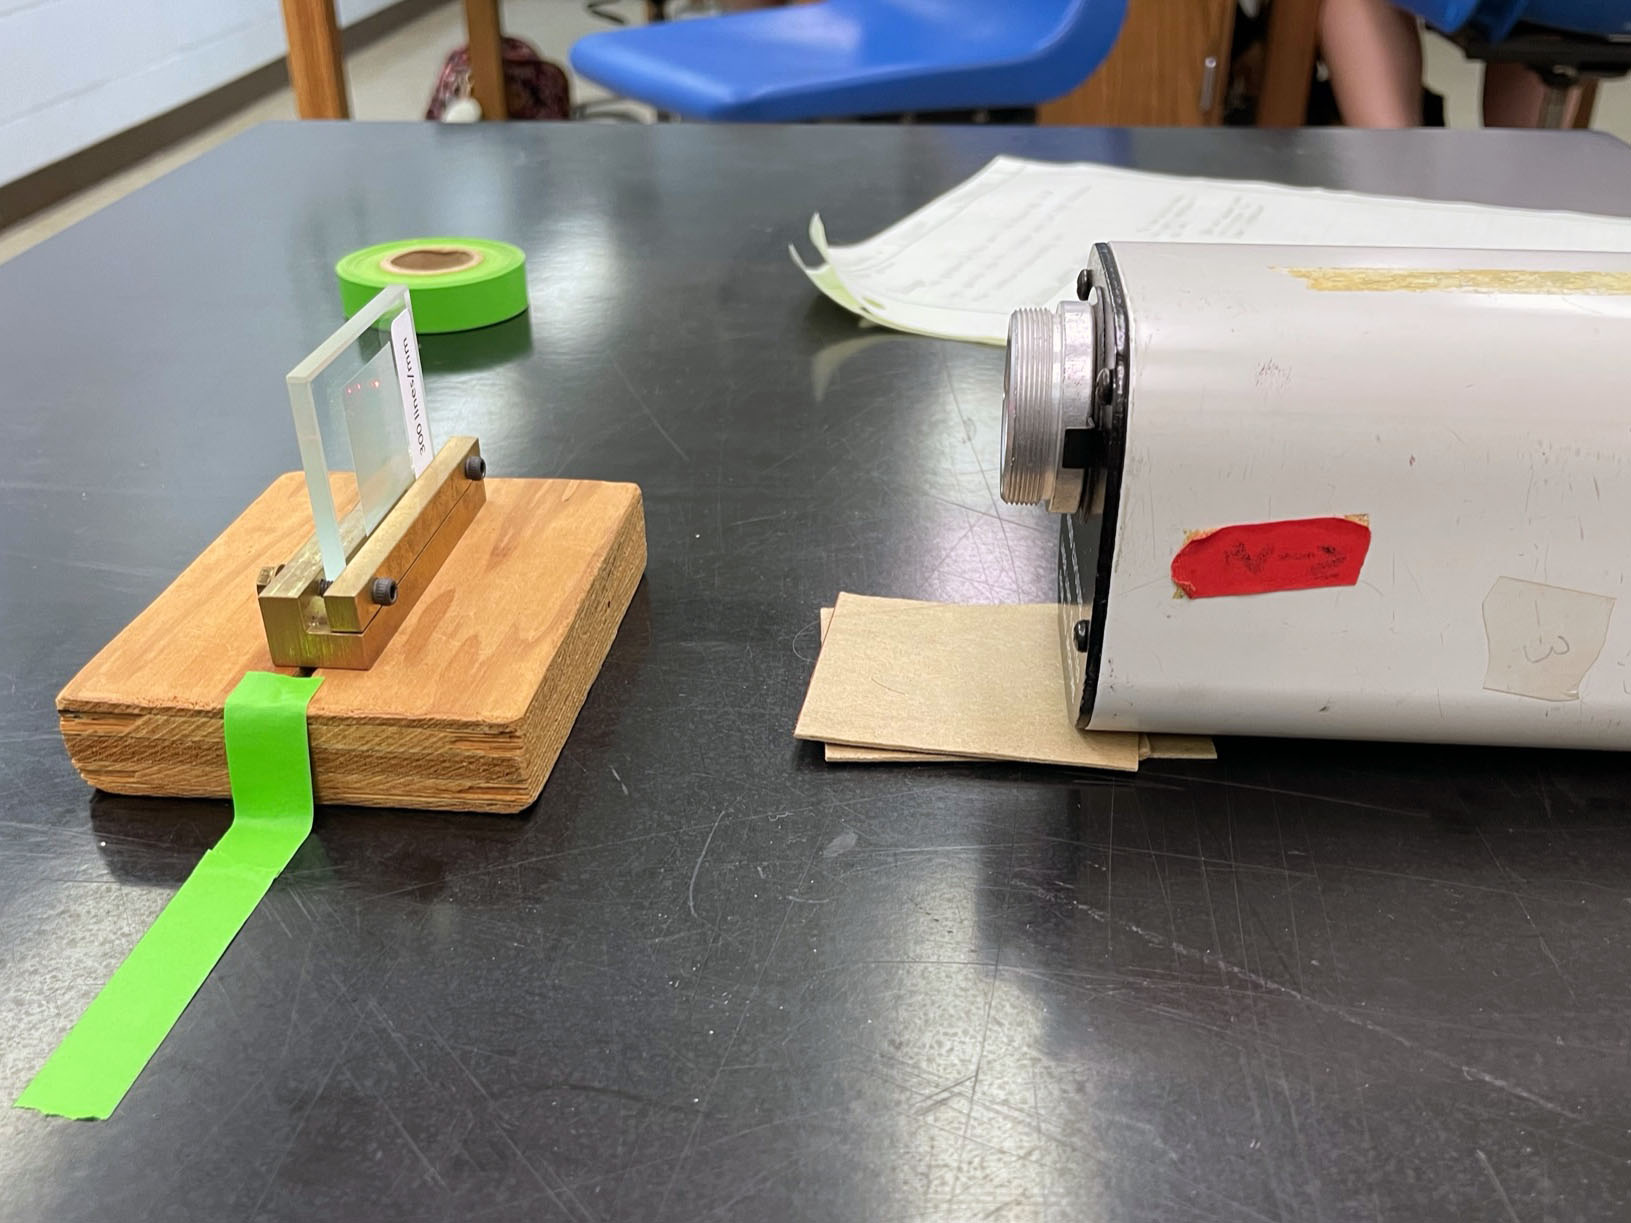
Figure 1: Use small cardboard shims to elevate
the front or back of the laser for proper alignment |
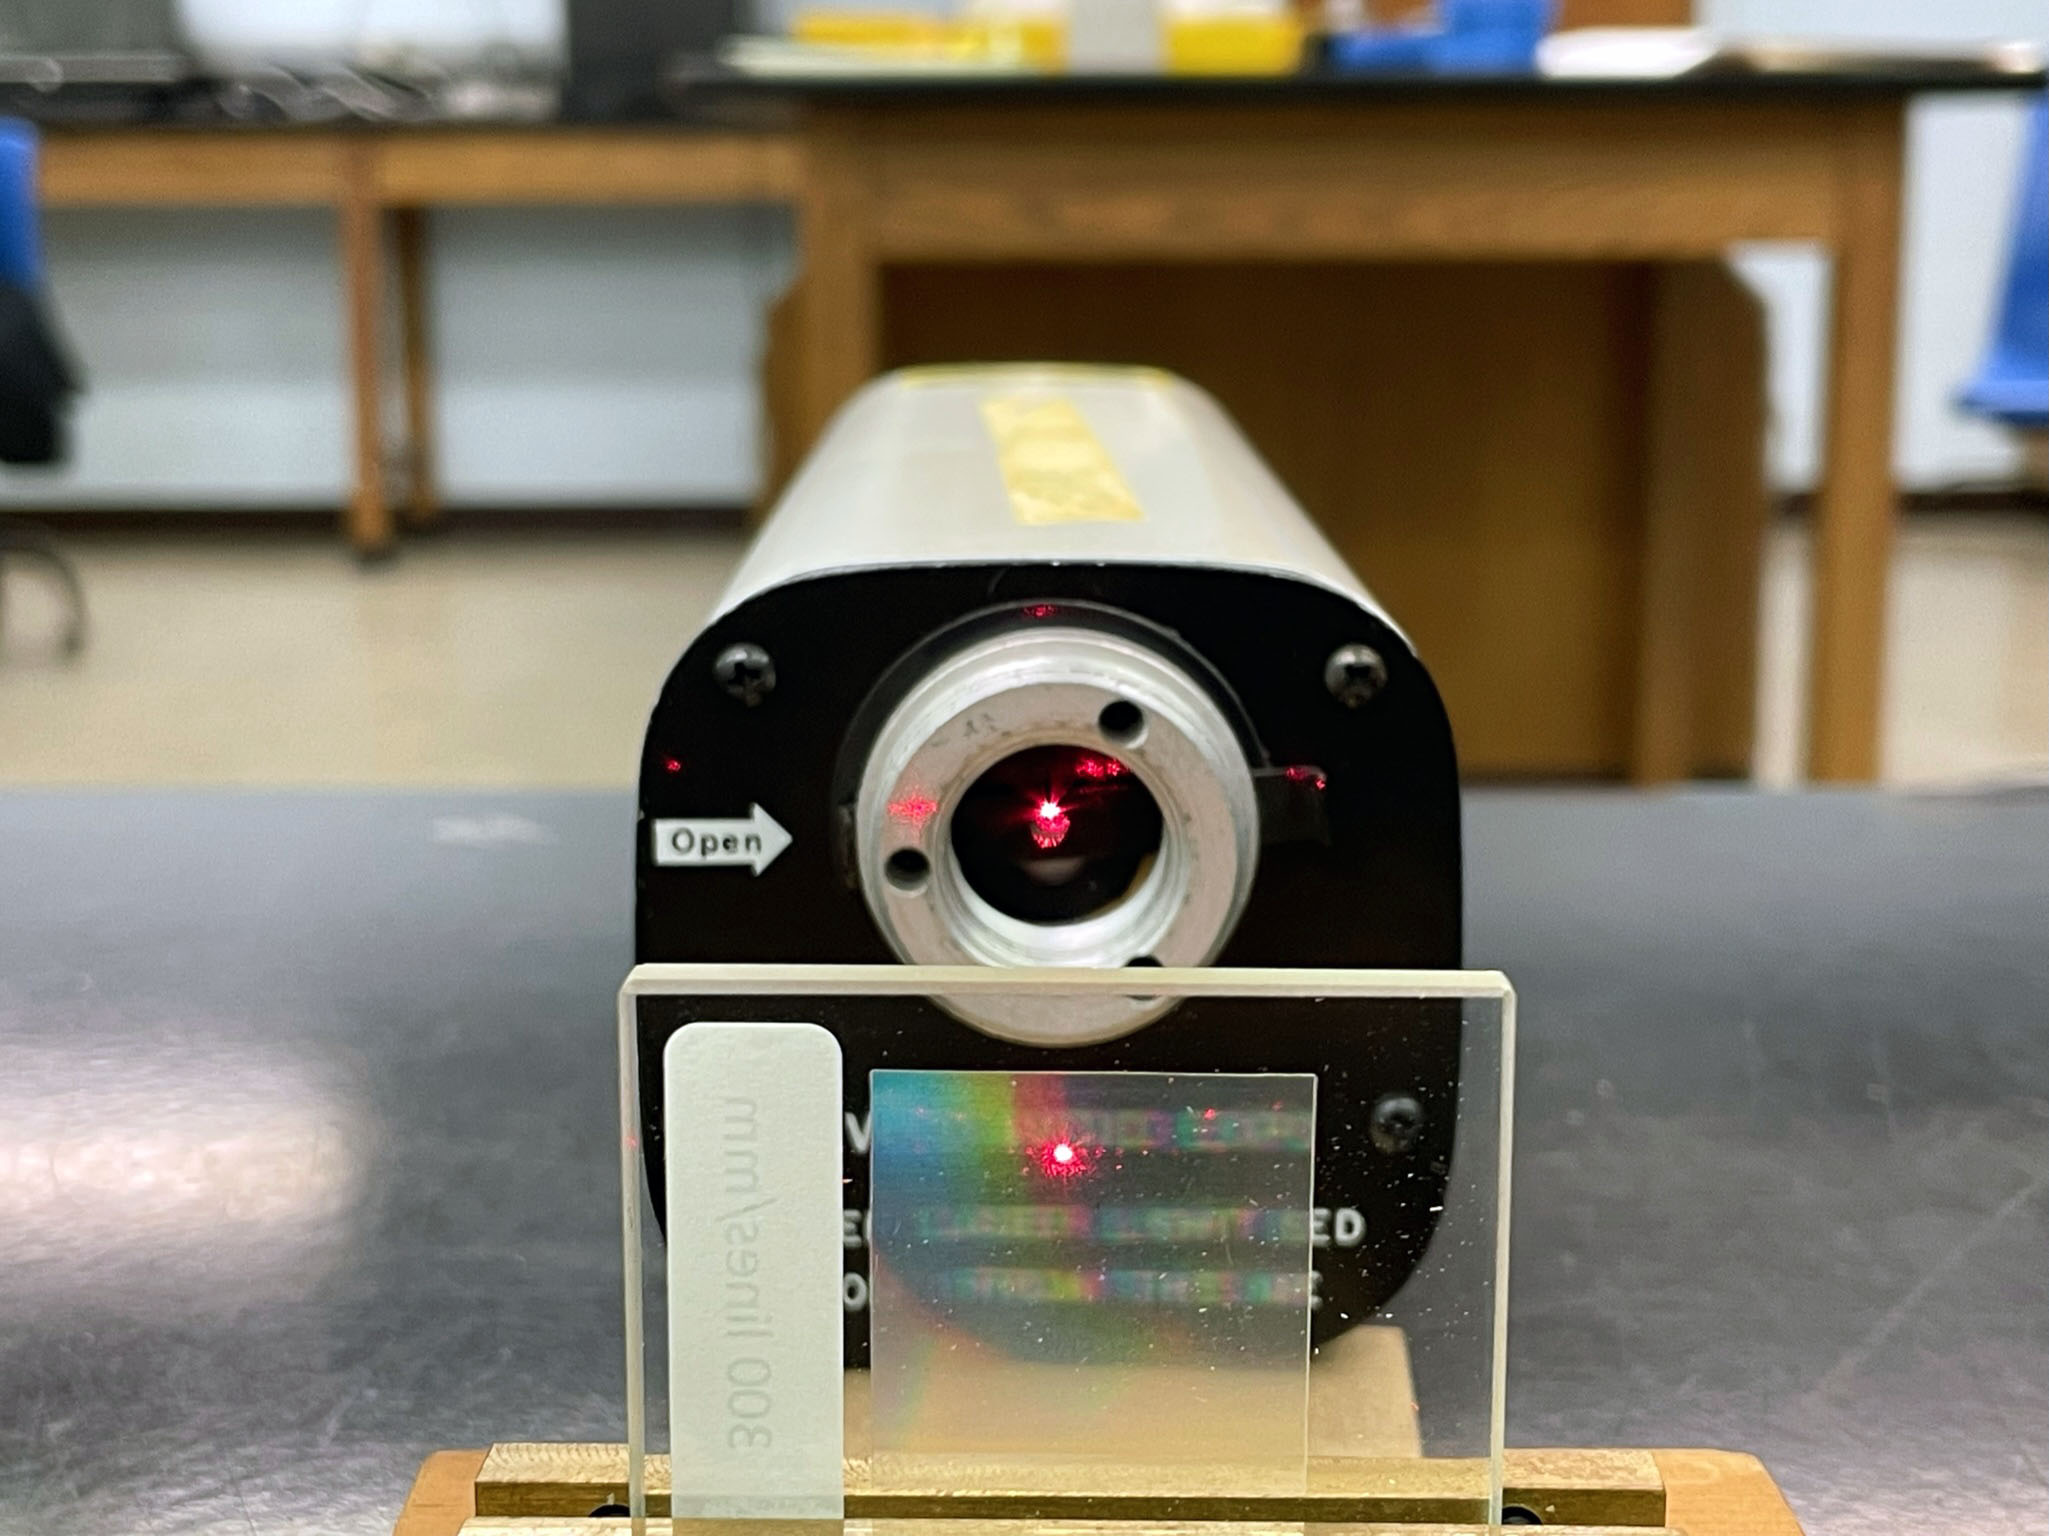
Figure 2: Note that the reflected zero-order beam is
above the laser emission port (at about 2 o'clock) |
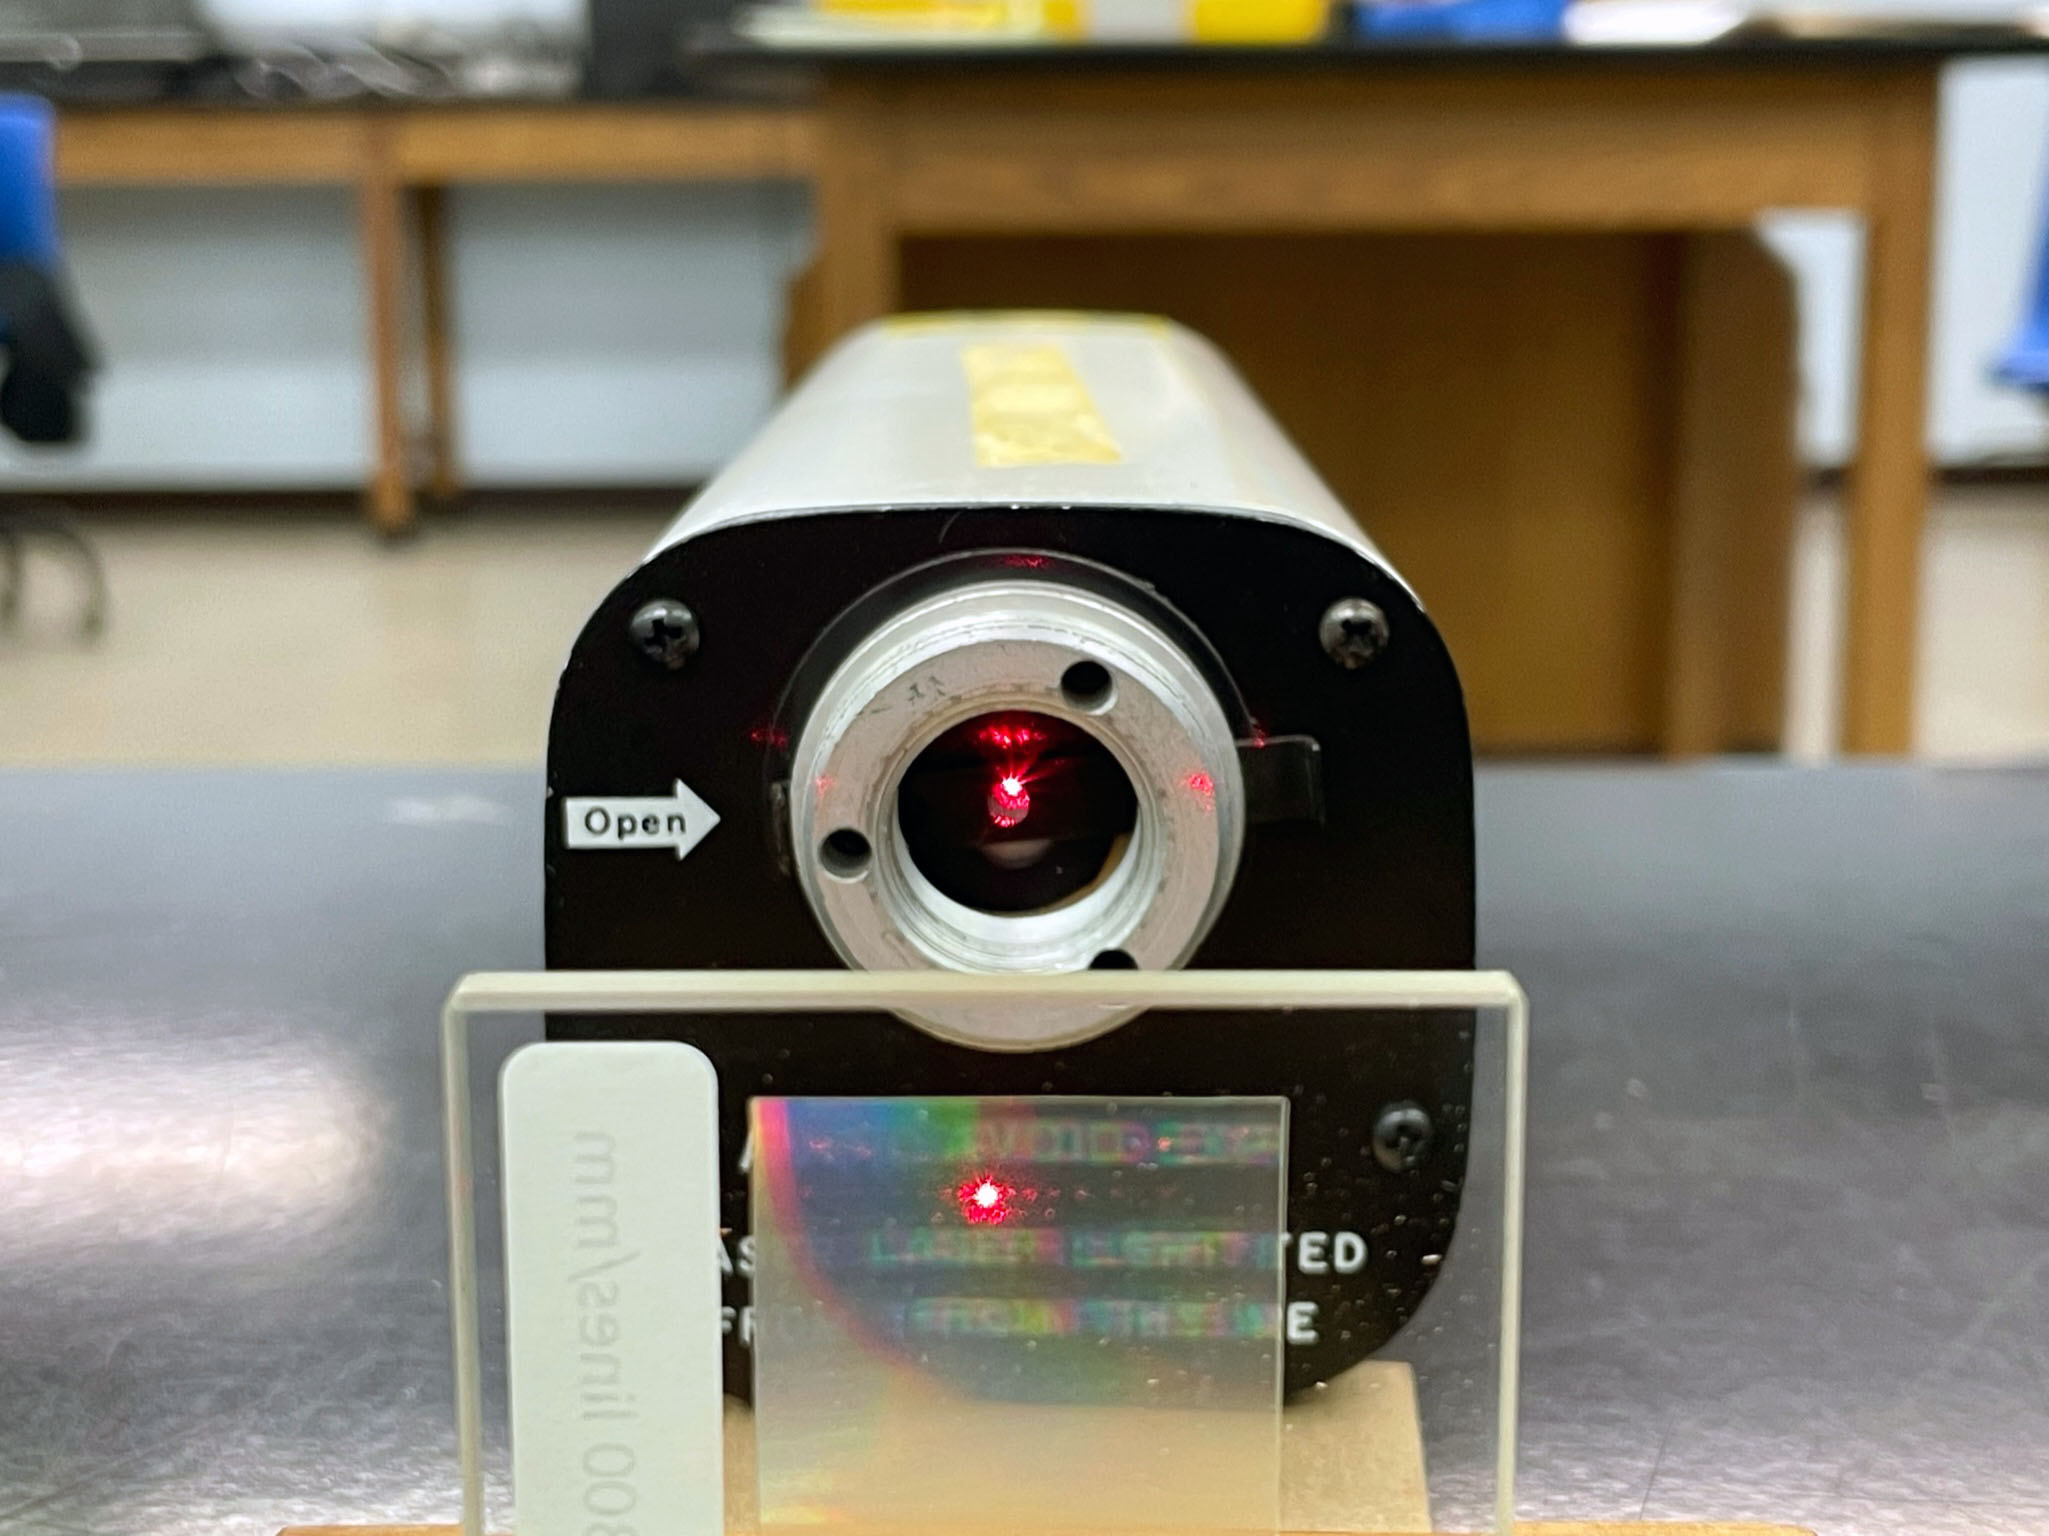
Figure 3: Rotate the left or right side of the grating so that
the reflected zero-order beam is aligned with the laser emission port |
Figure 4: Maximum number of lasers in BH231 |
Figure 5: Additional lasers can be set up in BH232 |
- Students will (must!) show you their calculated wavelengths before leaving the lab. I do a quick visual inspection of their wavelengths, maybe calculate a %difference, especially if it looks farther off than it should be (more than 1%). It's important that students calculate the correct wavelengths before they leave; other groups will use the spectrometers, so they likely won't be in the same configuration the following week. It's usually easy to catch errors that they've made. Some common mistakes:
- They measured D incorrectly: aside from the fact that some still can't read a 2-meter stick or tape measure properly, they should measure D from the grating to the wall, not the laser to the wall. A few centimeters here will have a dramatic effect
- If one or two of their wavelengths look good, but the other(s) don't, it's likely that they included (or omitted) 30' from the measurement on one side. Rechecking the angles for that color usually fixes the problem
- Jeff has an Excel spreadsheet to check student measurements. Enter their value of d for the grating and their original measurements (in degrees and arcminutes) and the wavelengths are calculated and compared to the values obtained from the energy level diagram. This makes it easy to tell if they added/neglected 30' from one of their measurements if you didn't catch it while they were doing the experiment. You know the drill
- Actual values: Note that the value of d will depend on which grating students use. As of Spring 2019, all spectrometers will use the new glass gratings
- New gratings (used as of Spring 2019): These gratings are blazed, so even though the label says 300 lines/mm, you don't get that value from our calibration
- d = 3384.93 nm (measured 13 April, 2018)
- Note that one of the gratings makes the zeroth-order image of the hydrogen bulb look blue, not pink. I haven't a clue why but it does not affect the wavelengths you can obtain
- Two of the gratings are very difficult to see the violet line on one side. If these gratings need to be used, you'll likely have to help students align the spectrometer correctly
- Original gratings – calculated from manufacturer's value of 300 lines/mm
- d = 3333.3 nm
(original gratings )
- A variac is now placed with each setup. The new (blazed) gratings can make the violet line (Hγ) difficult to see on one side, so the variac can be used to turn down the brightness of the spectrometer's internal light source
- Color, wavelength and angles:
- Red: Hα = 655.9 nm, θα = 11.35°
- Blue: Hβ = 485.8 nm, θβ = 8.38°
- Violet: Hγ = 433.8 nm, θγ = 7.48°
- Violet: Hδ = 409.9 nm – not observed
- I can't get the room dark enough to see the Hδ spectral line. Even when moving the spectrometer into the darkroom, the line is barely discernible with the original gratings we used to use (the internal light source needs to be turned off). Here are my measurements for this line (collected 11 April, 2017):
- θLeft = 228° 02' = 228.03°
- θRight = 213° 57' = 213.95°
- So, θδ = 7.04°, and λδ = 408.6 nm, for a difference of 0.3%. Boo-ya!
- When everyone is finished, tip over all the flashlights. Students will frequently leave them turned on and place them face-down on the bench, draining the batteries. Because the lab might still be dark when they leave, they frequently forget to remove tape on the bench, as well as their calculators and water bottles!
|